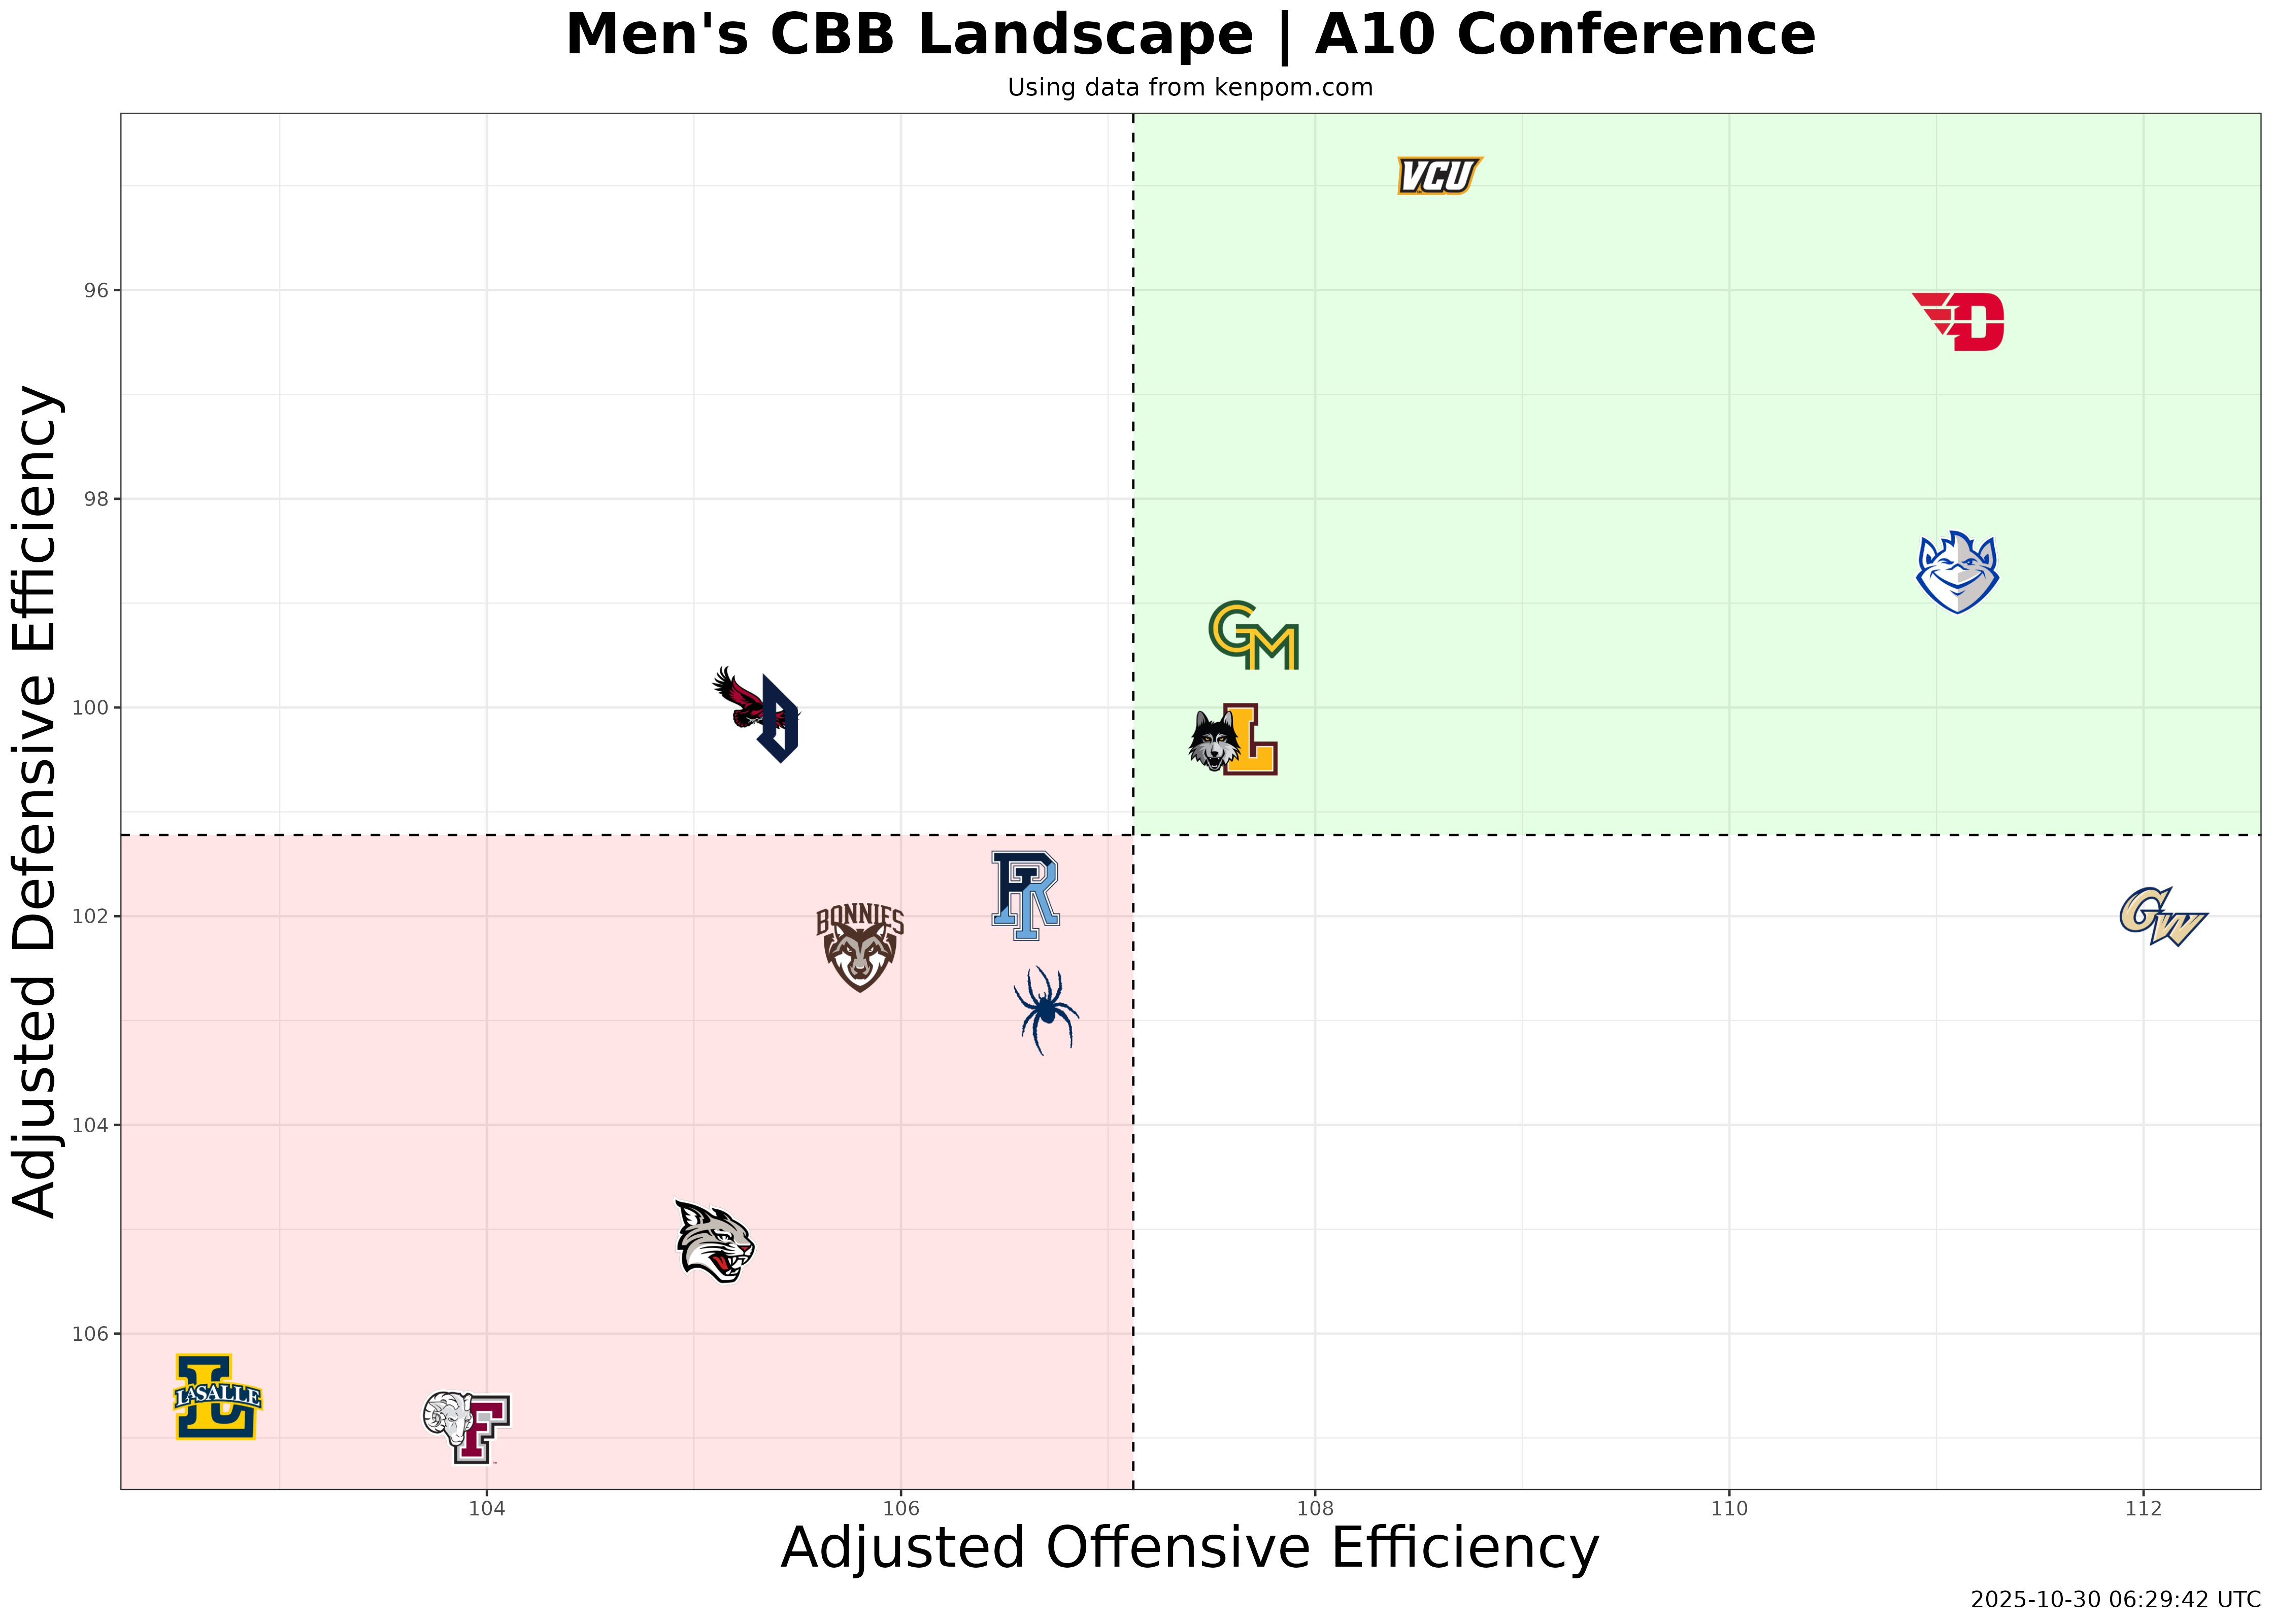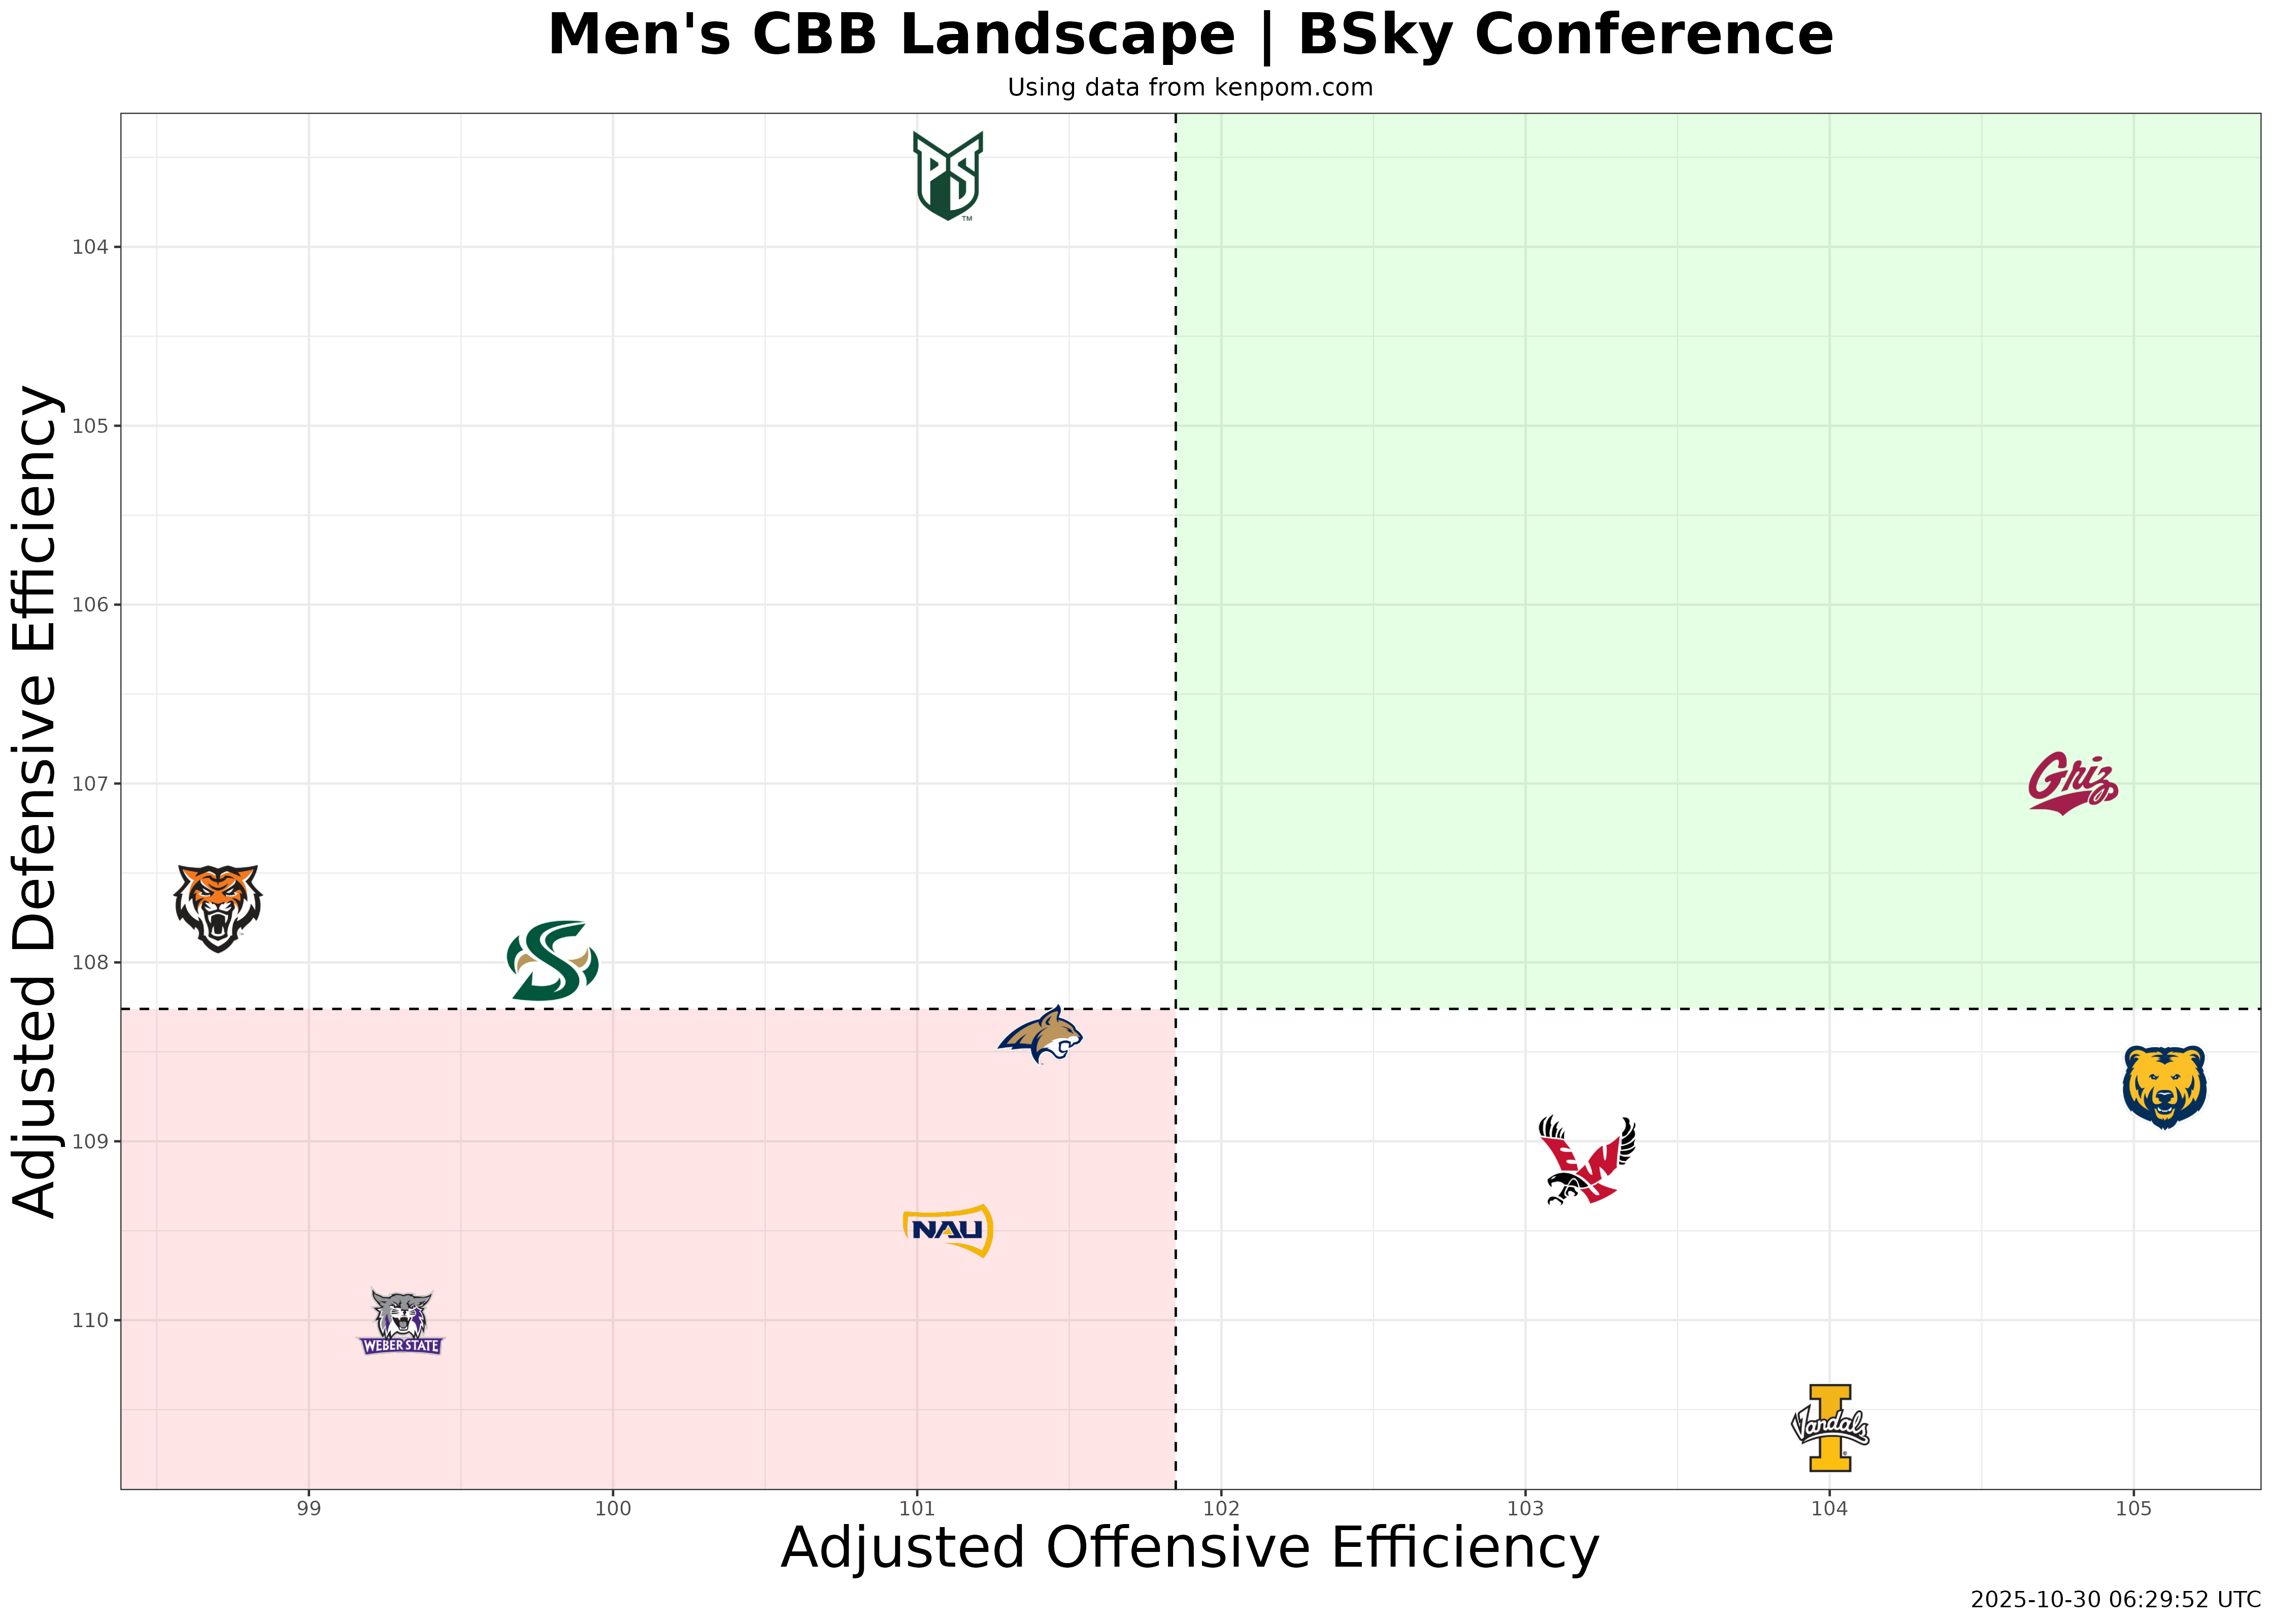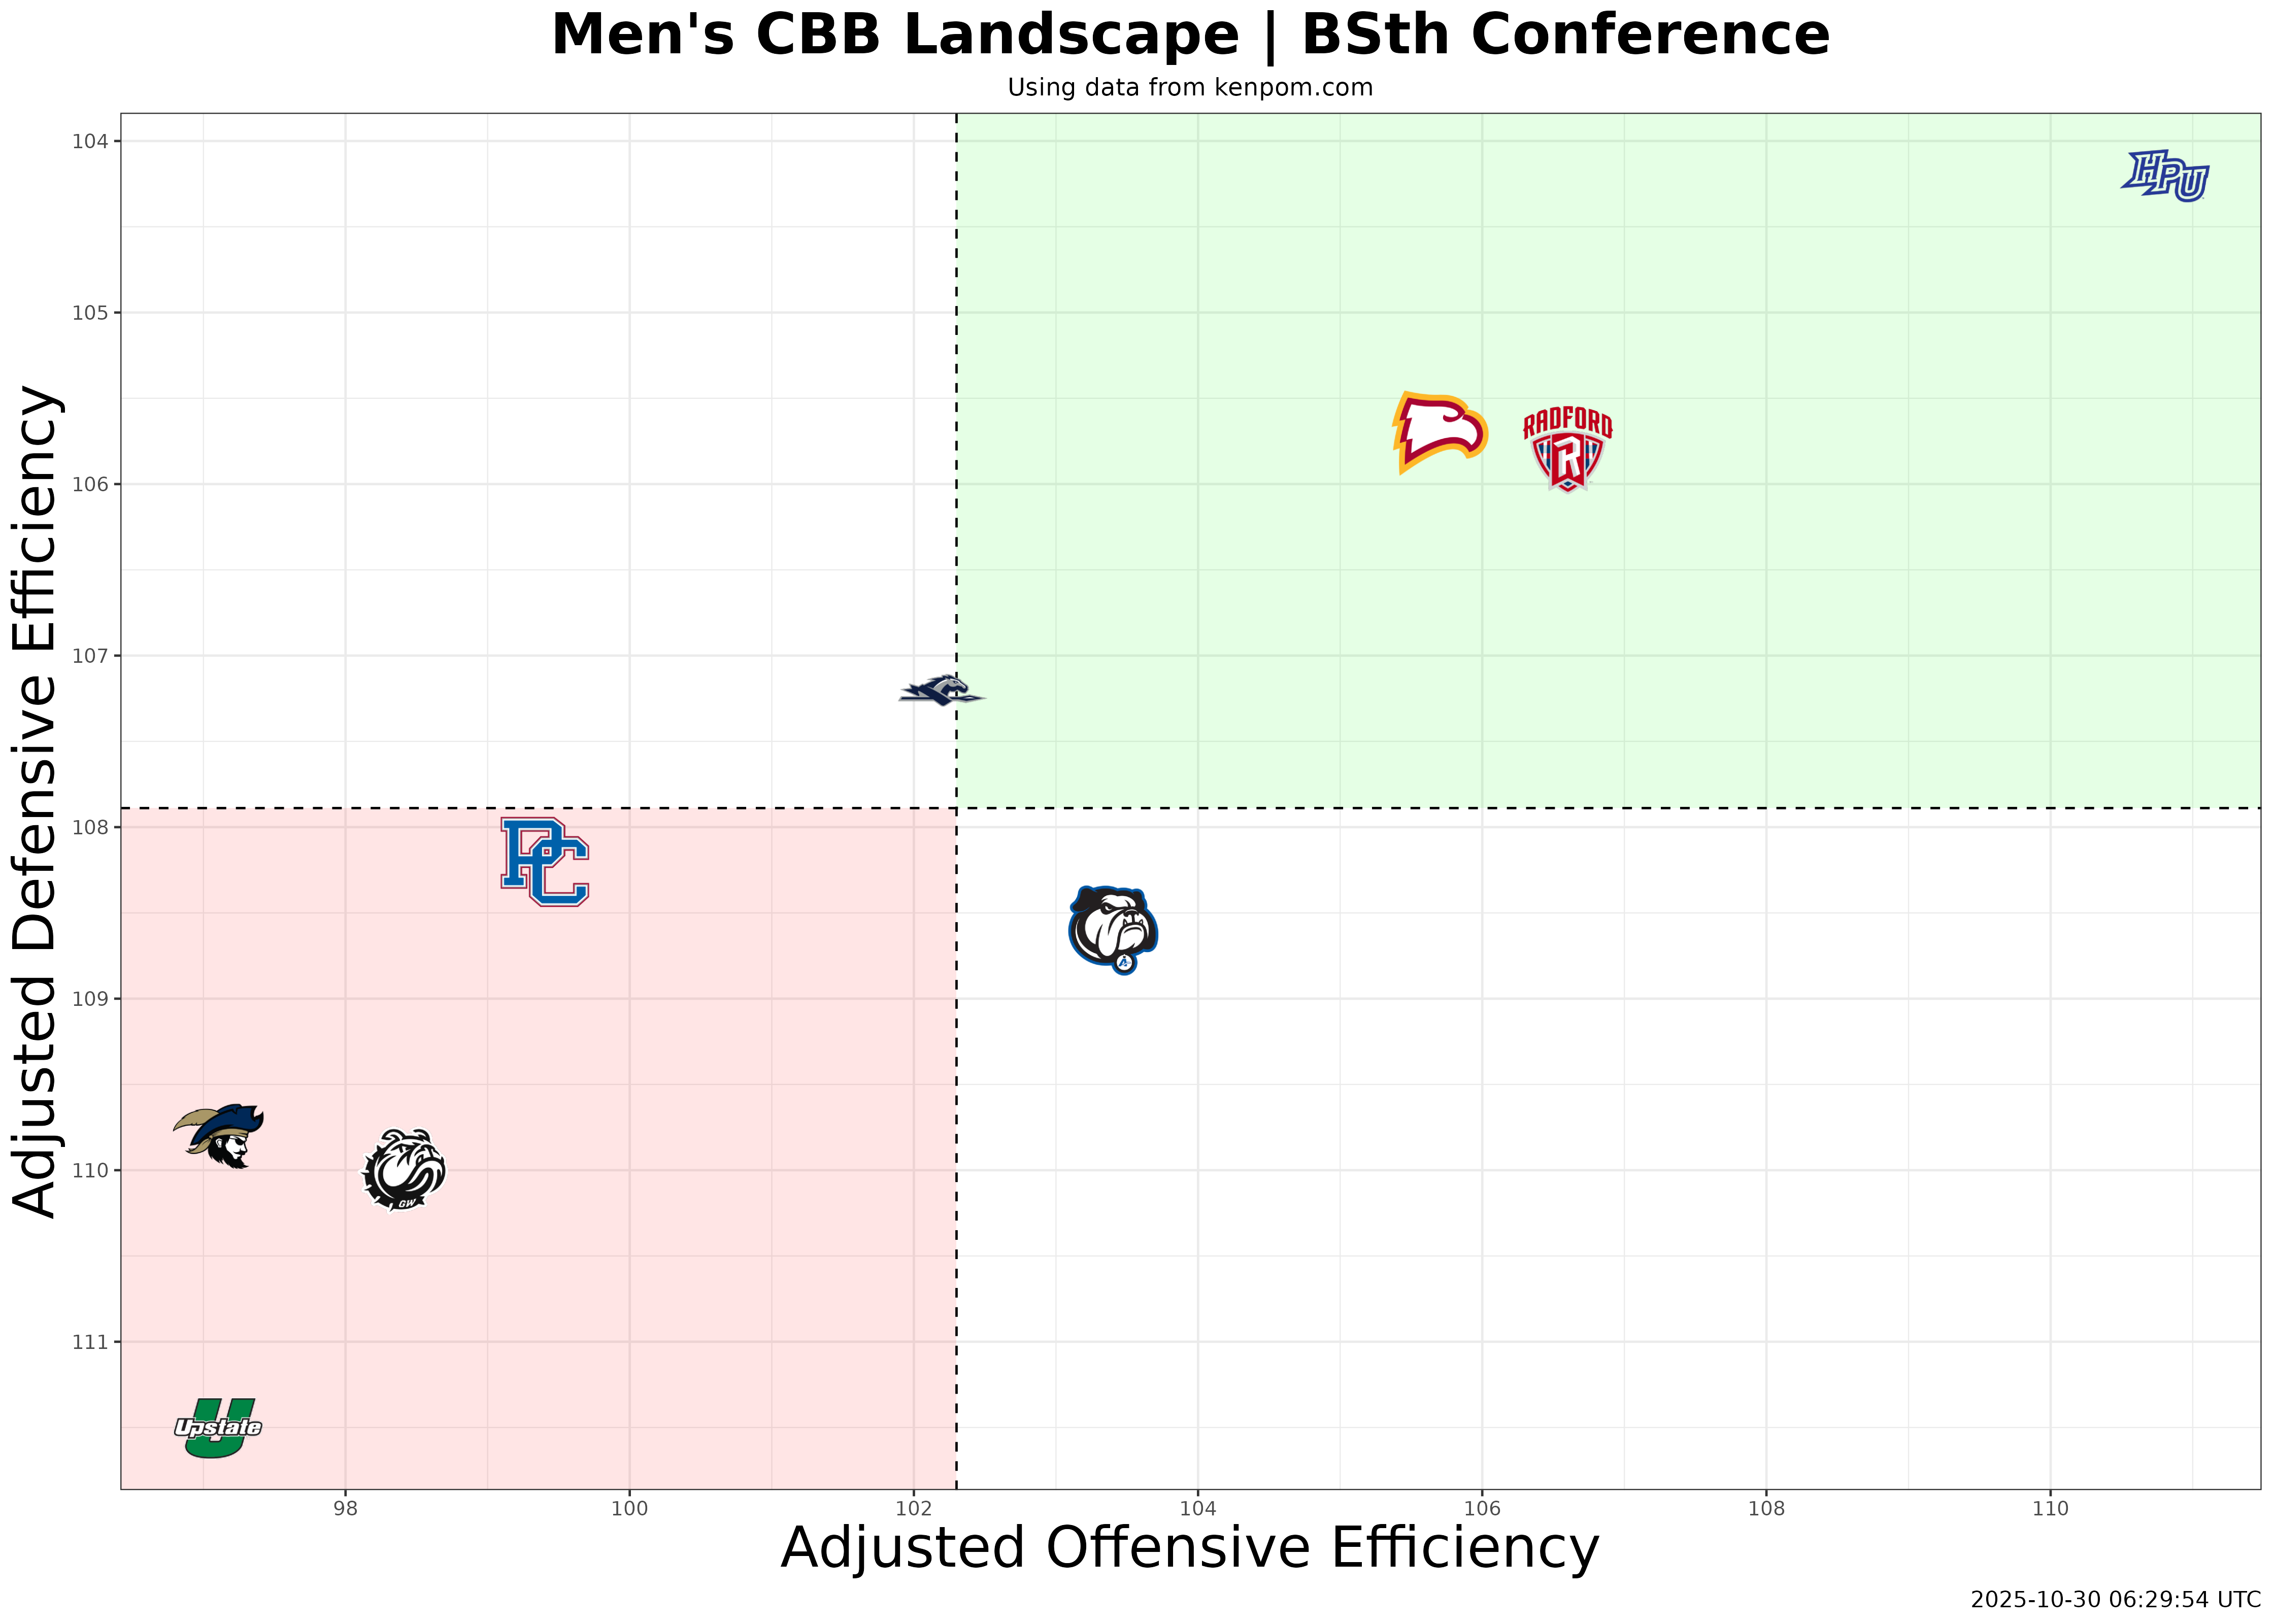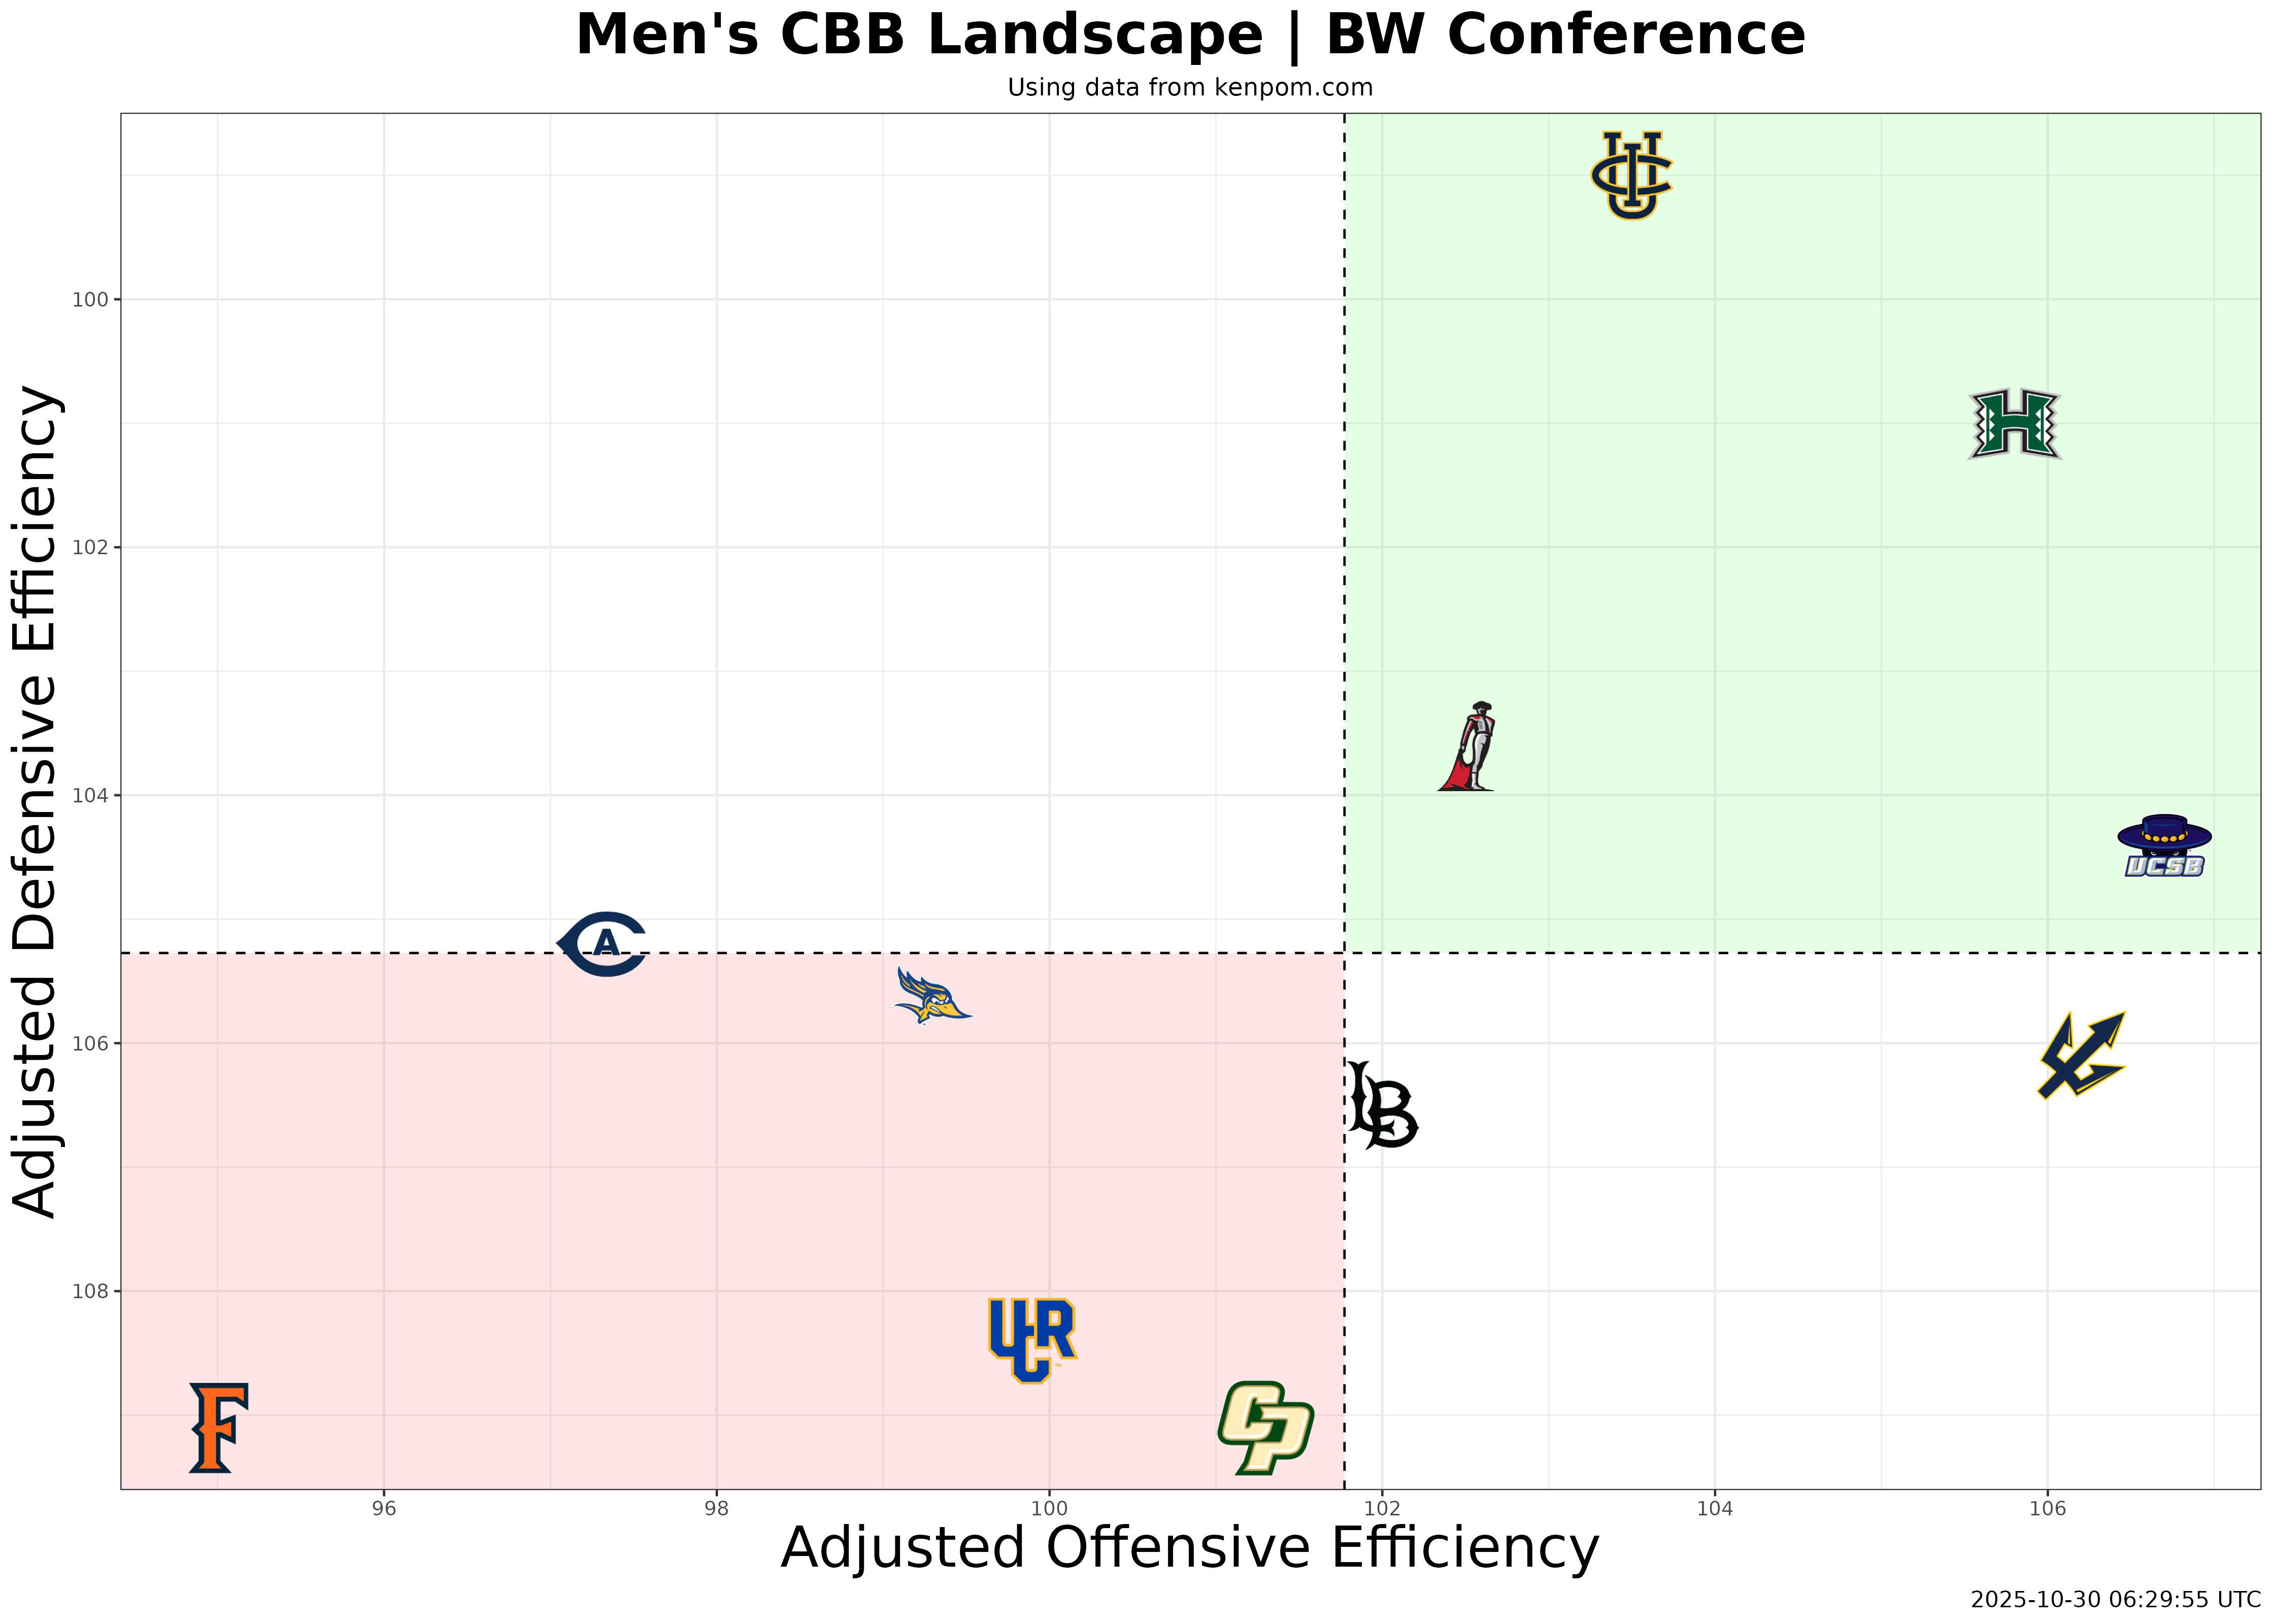
NCAA Conference Power Ratings
Click conference name to jump to landscape
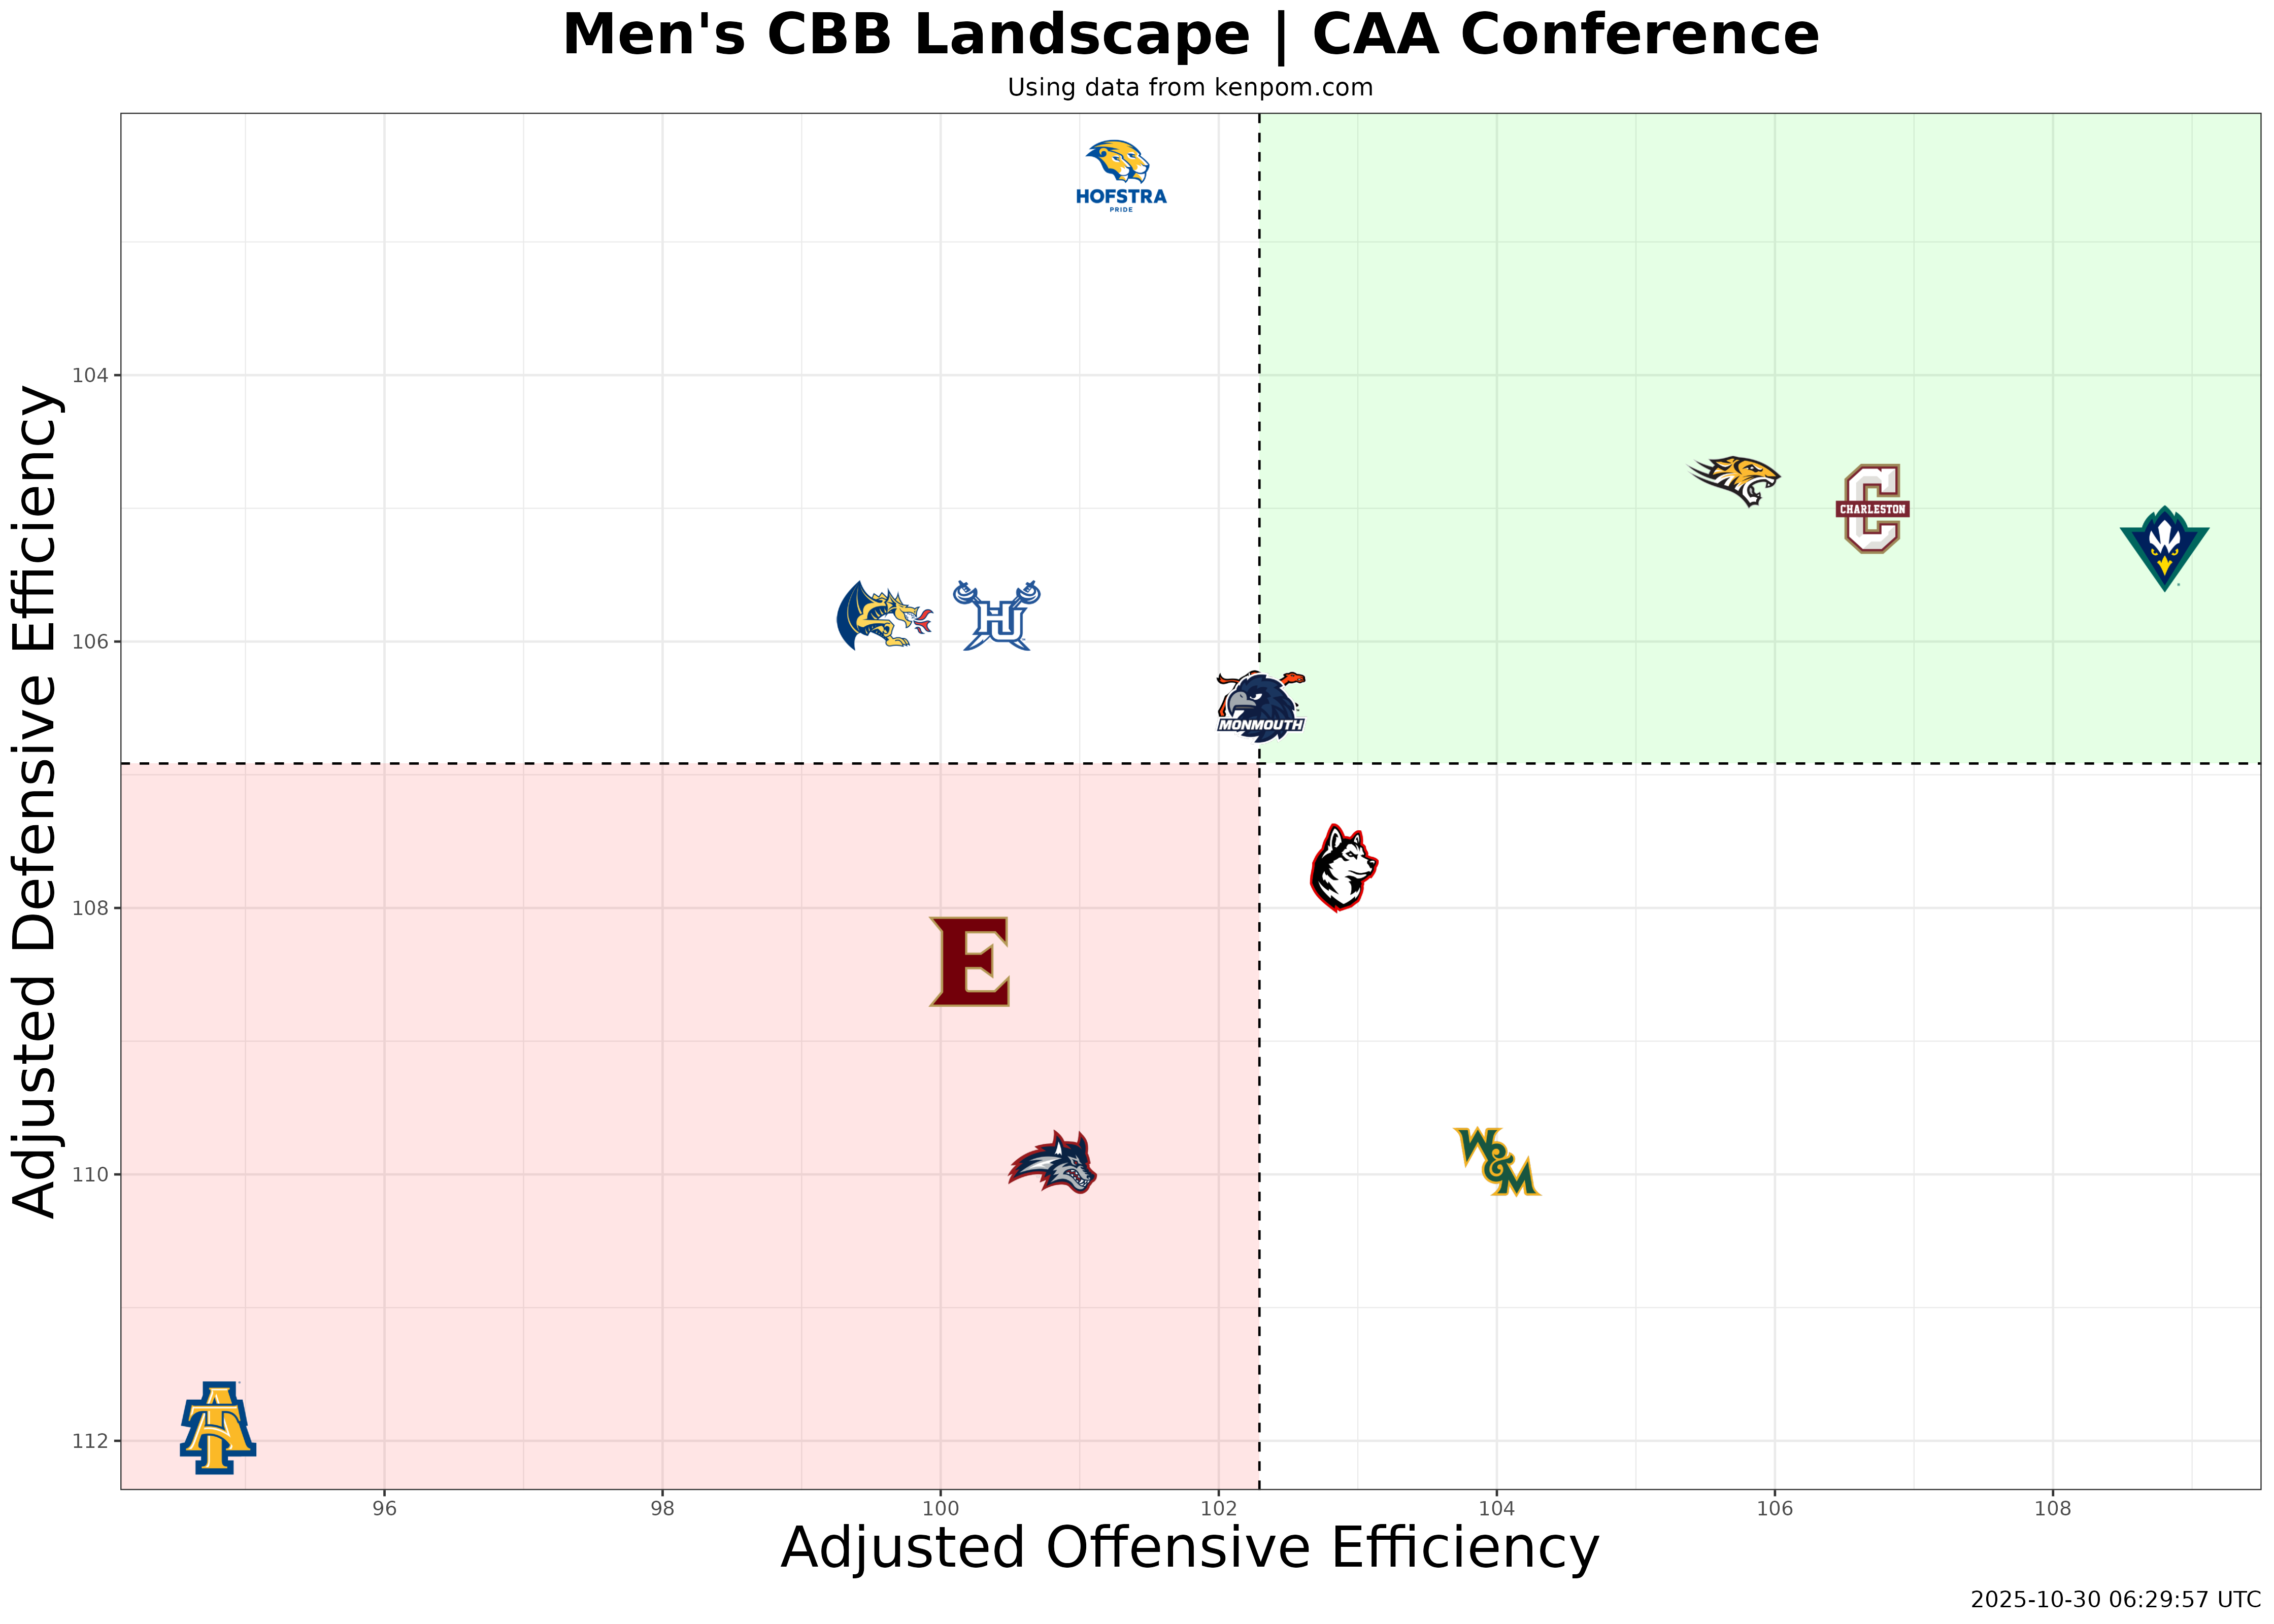
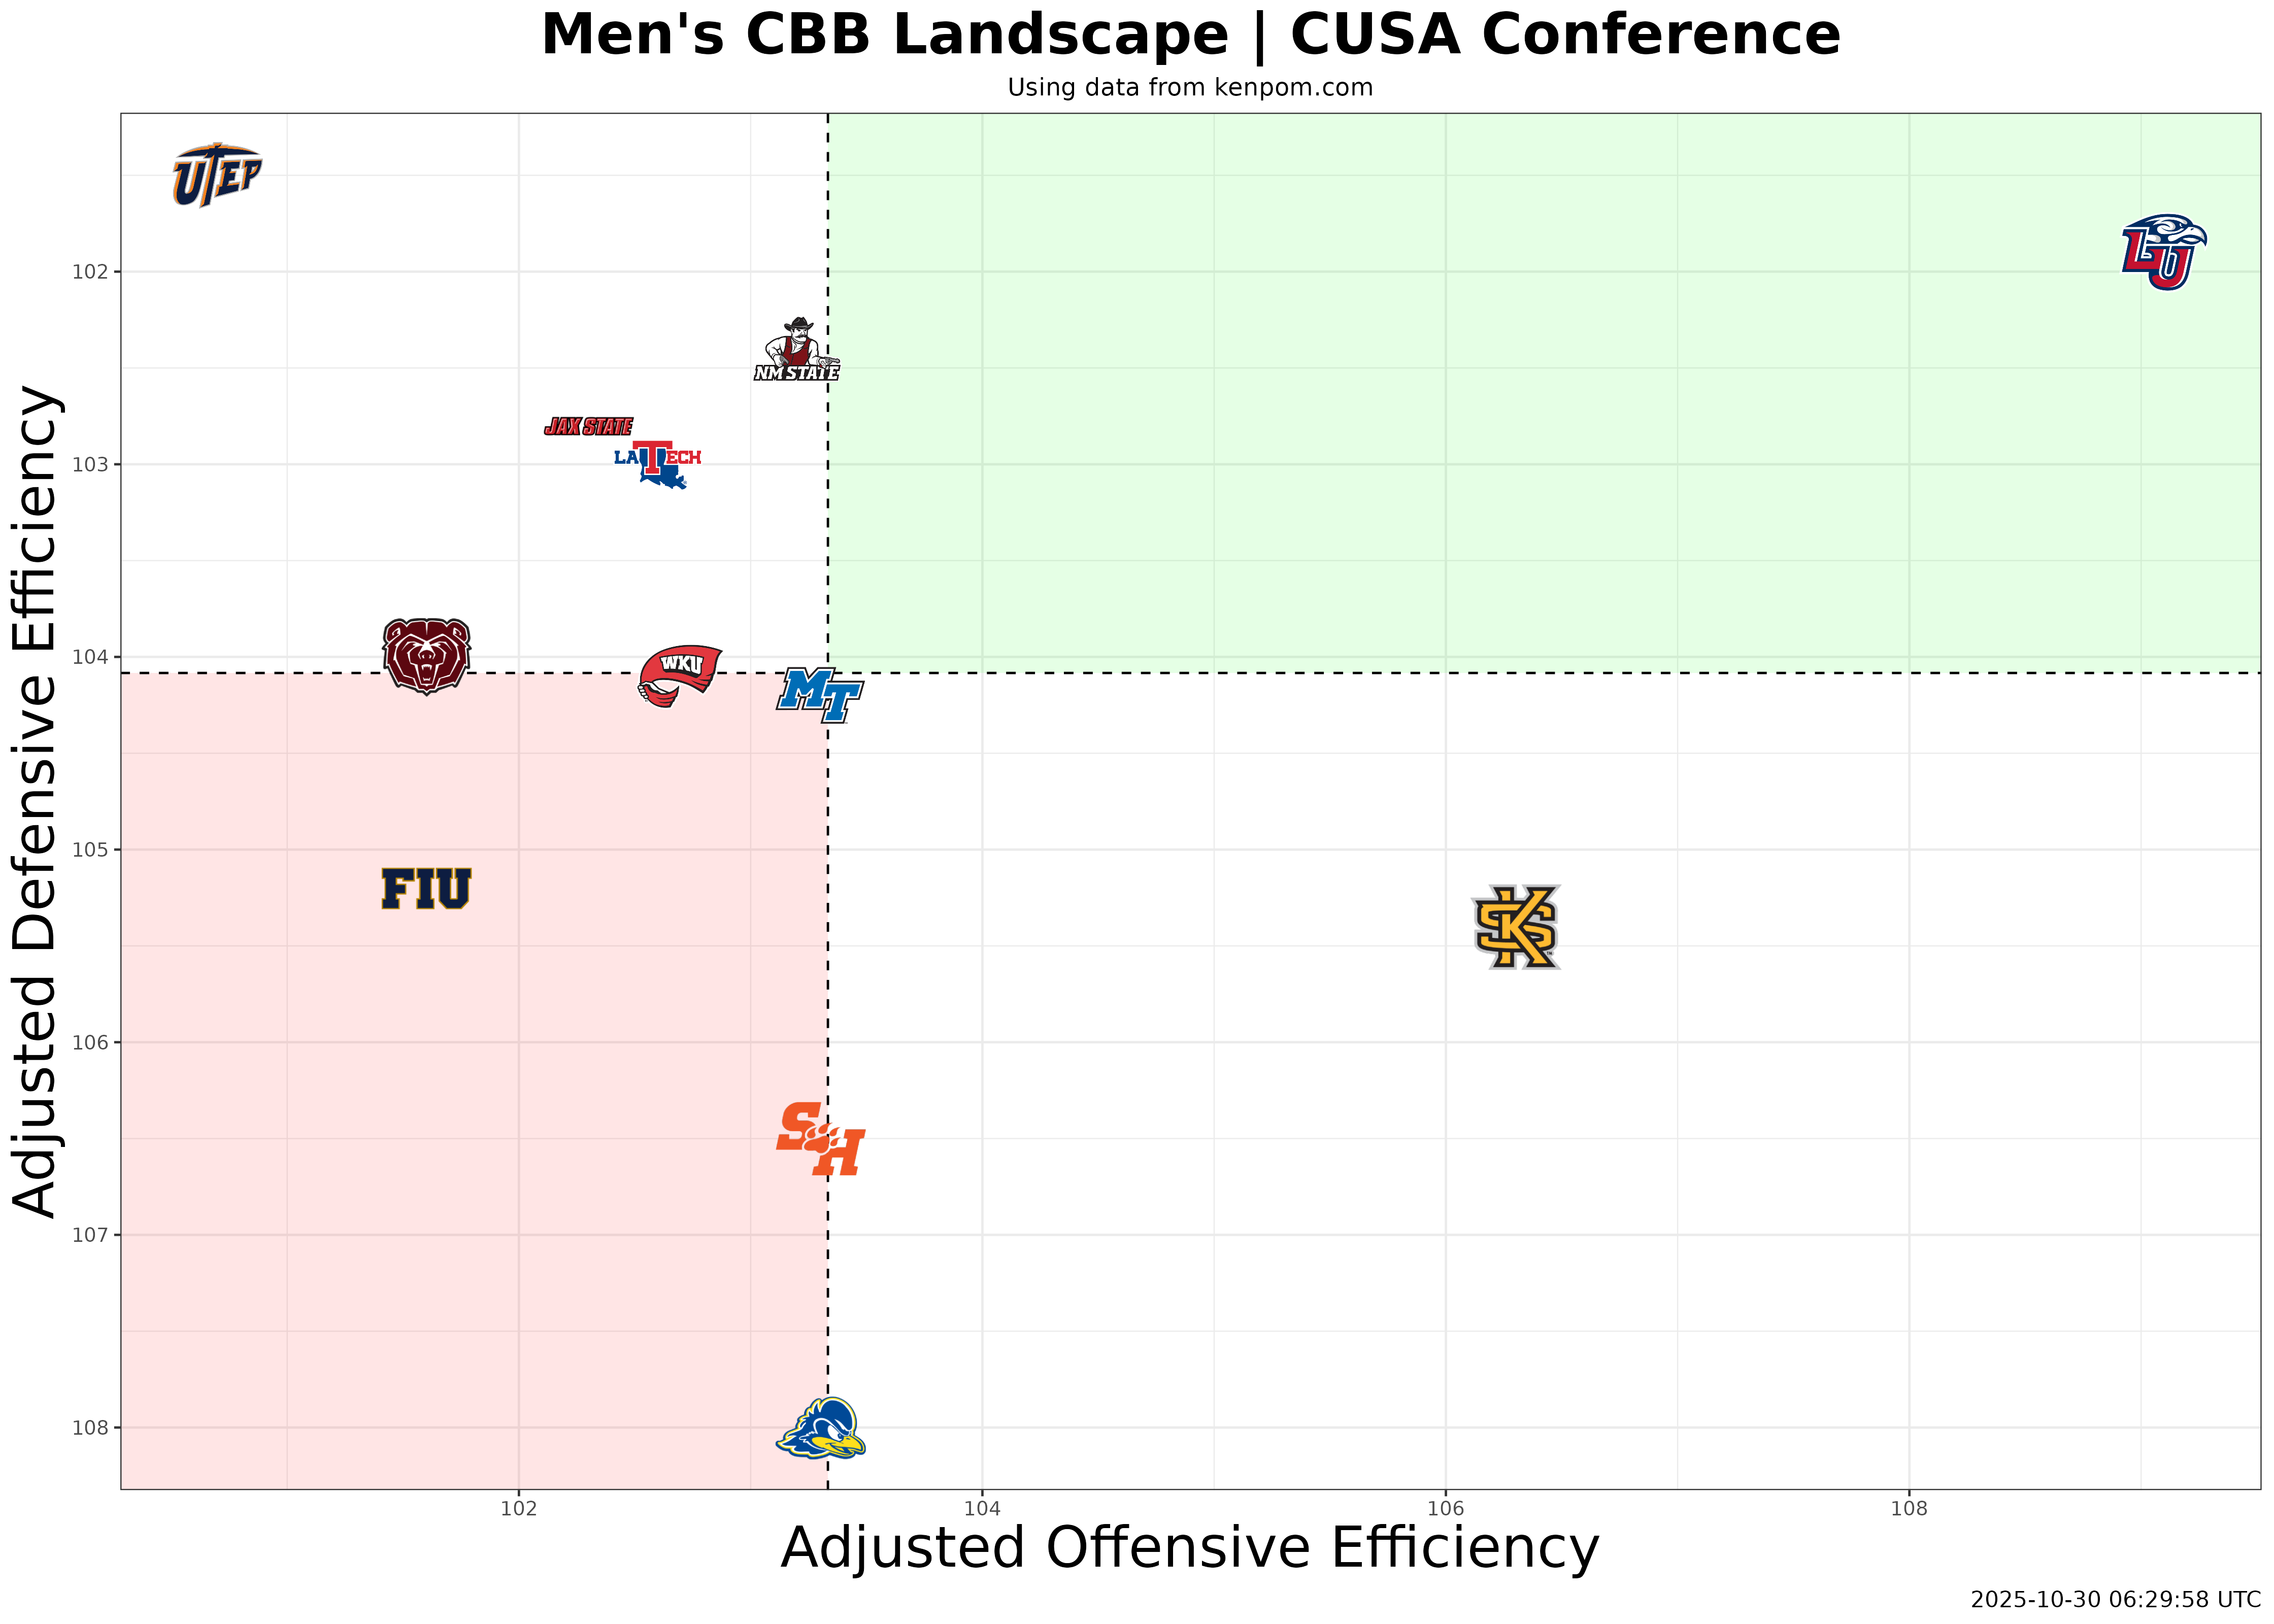
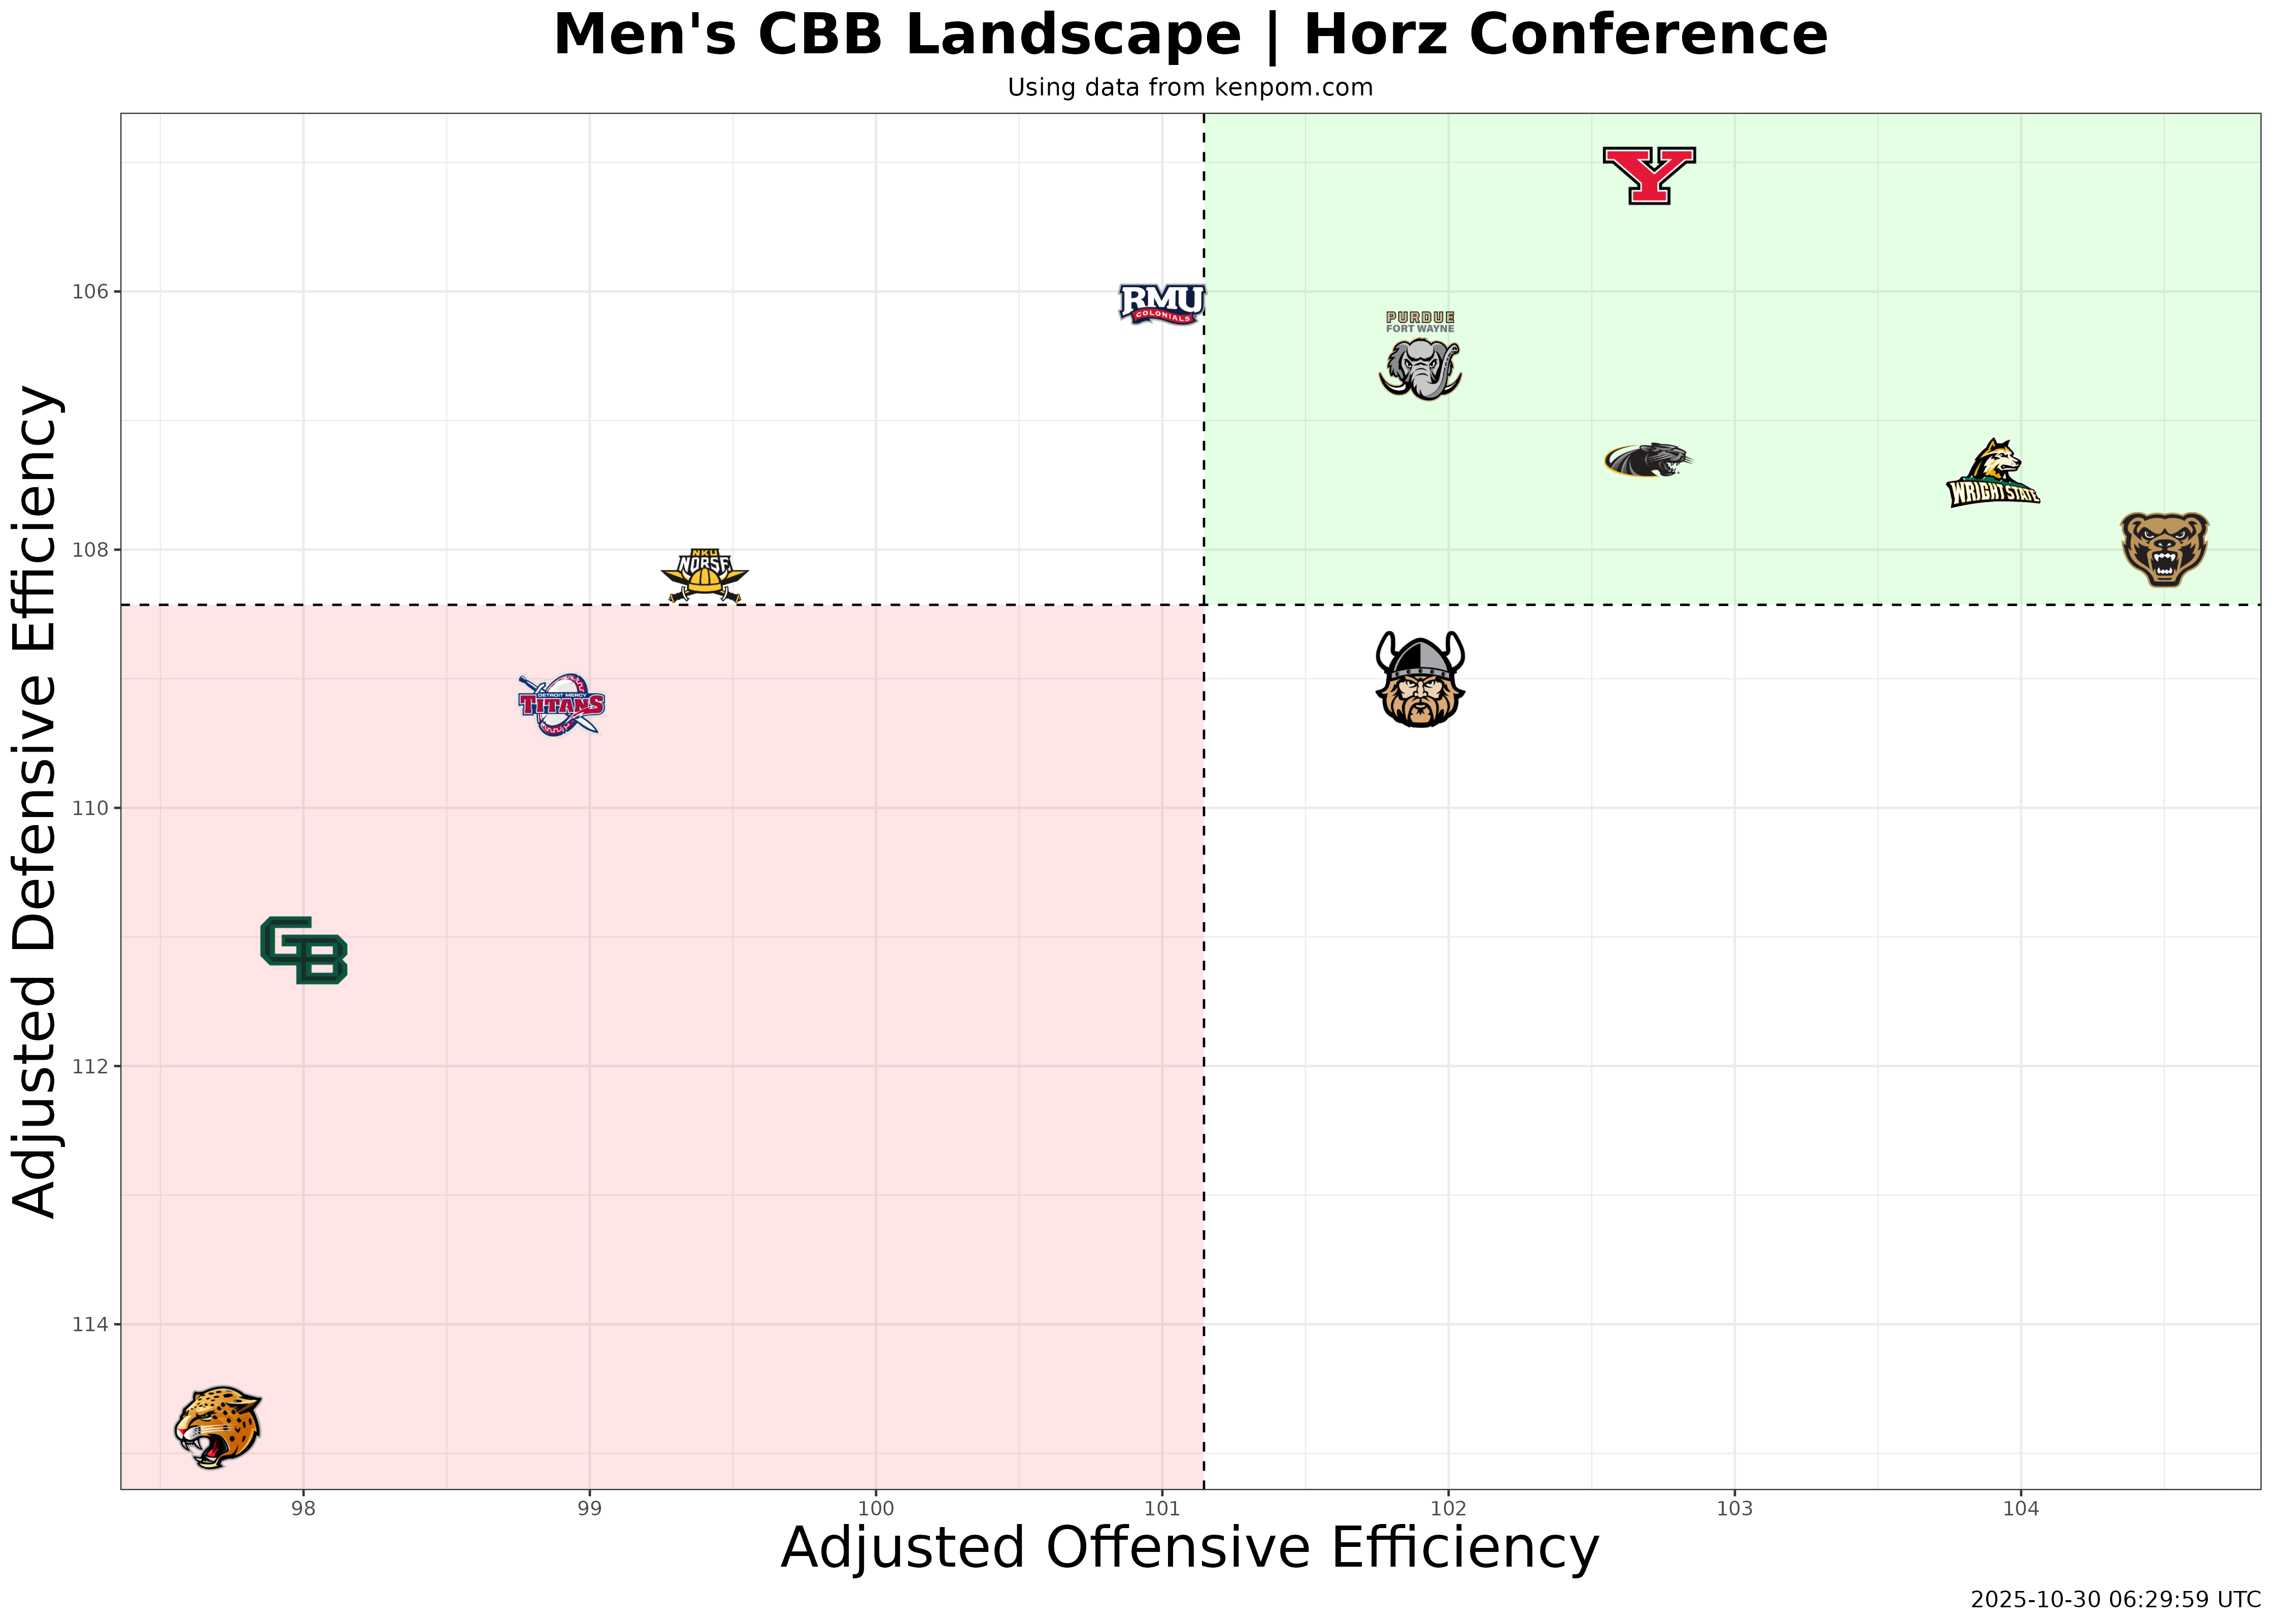
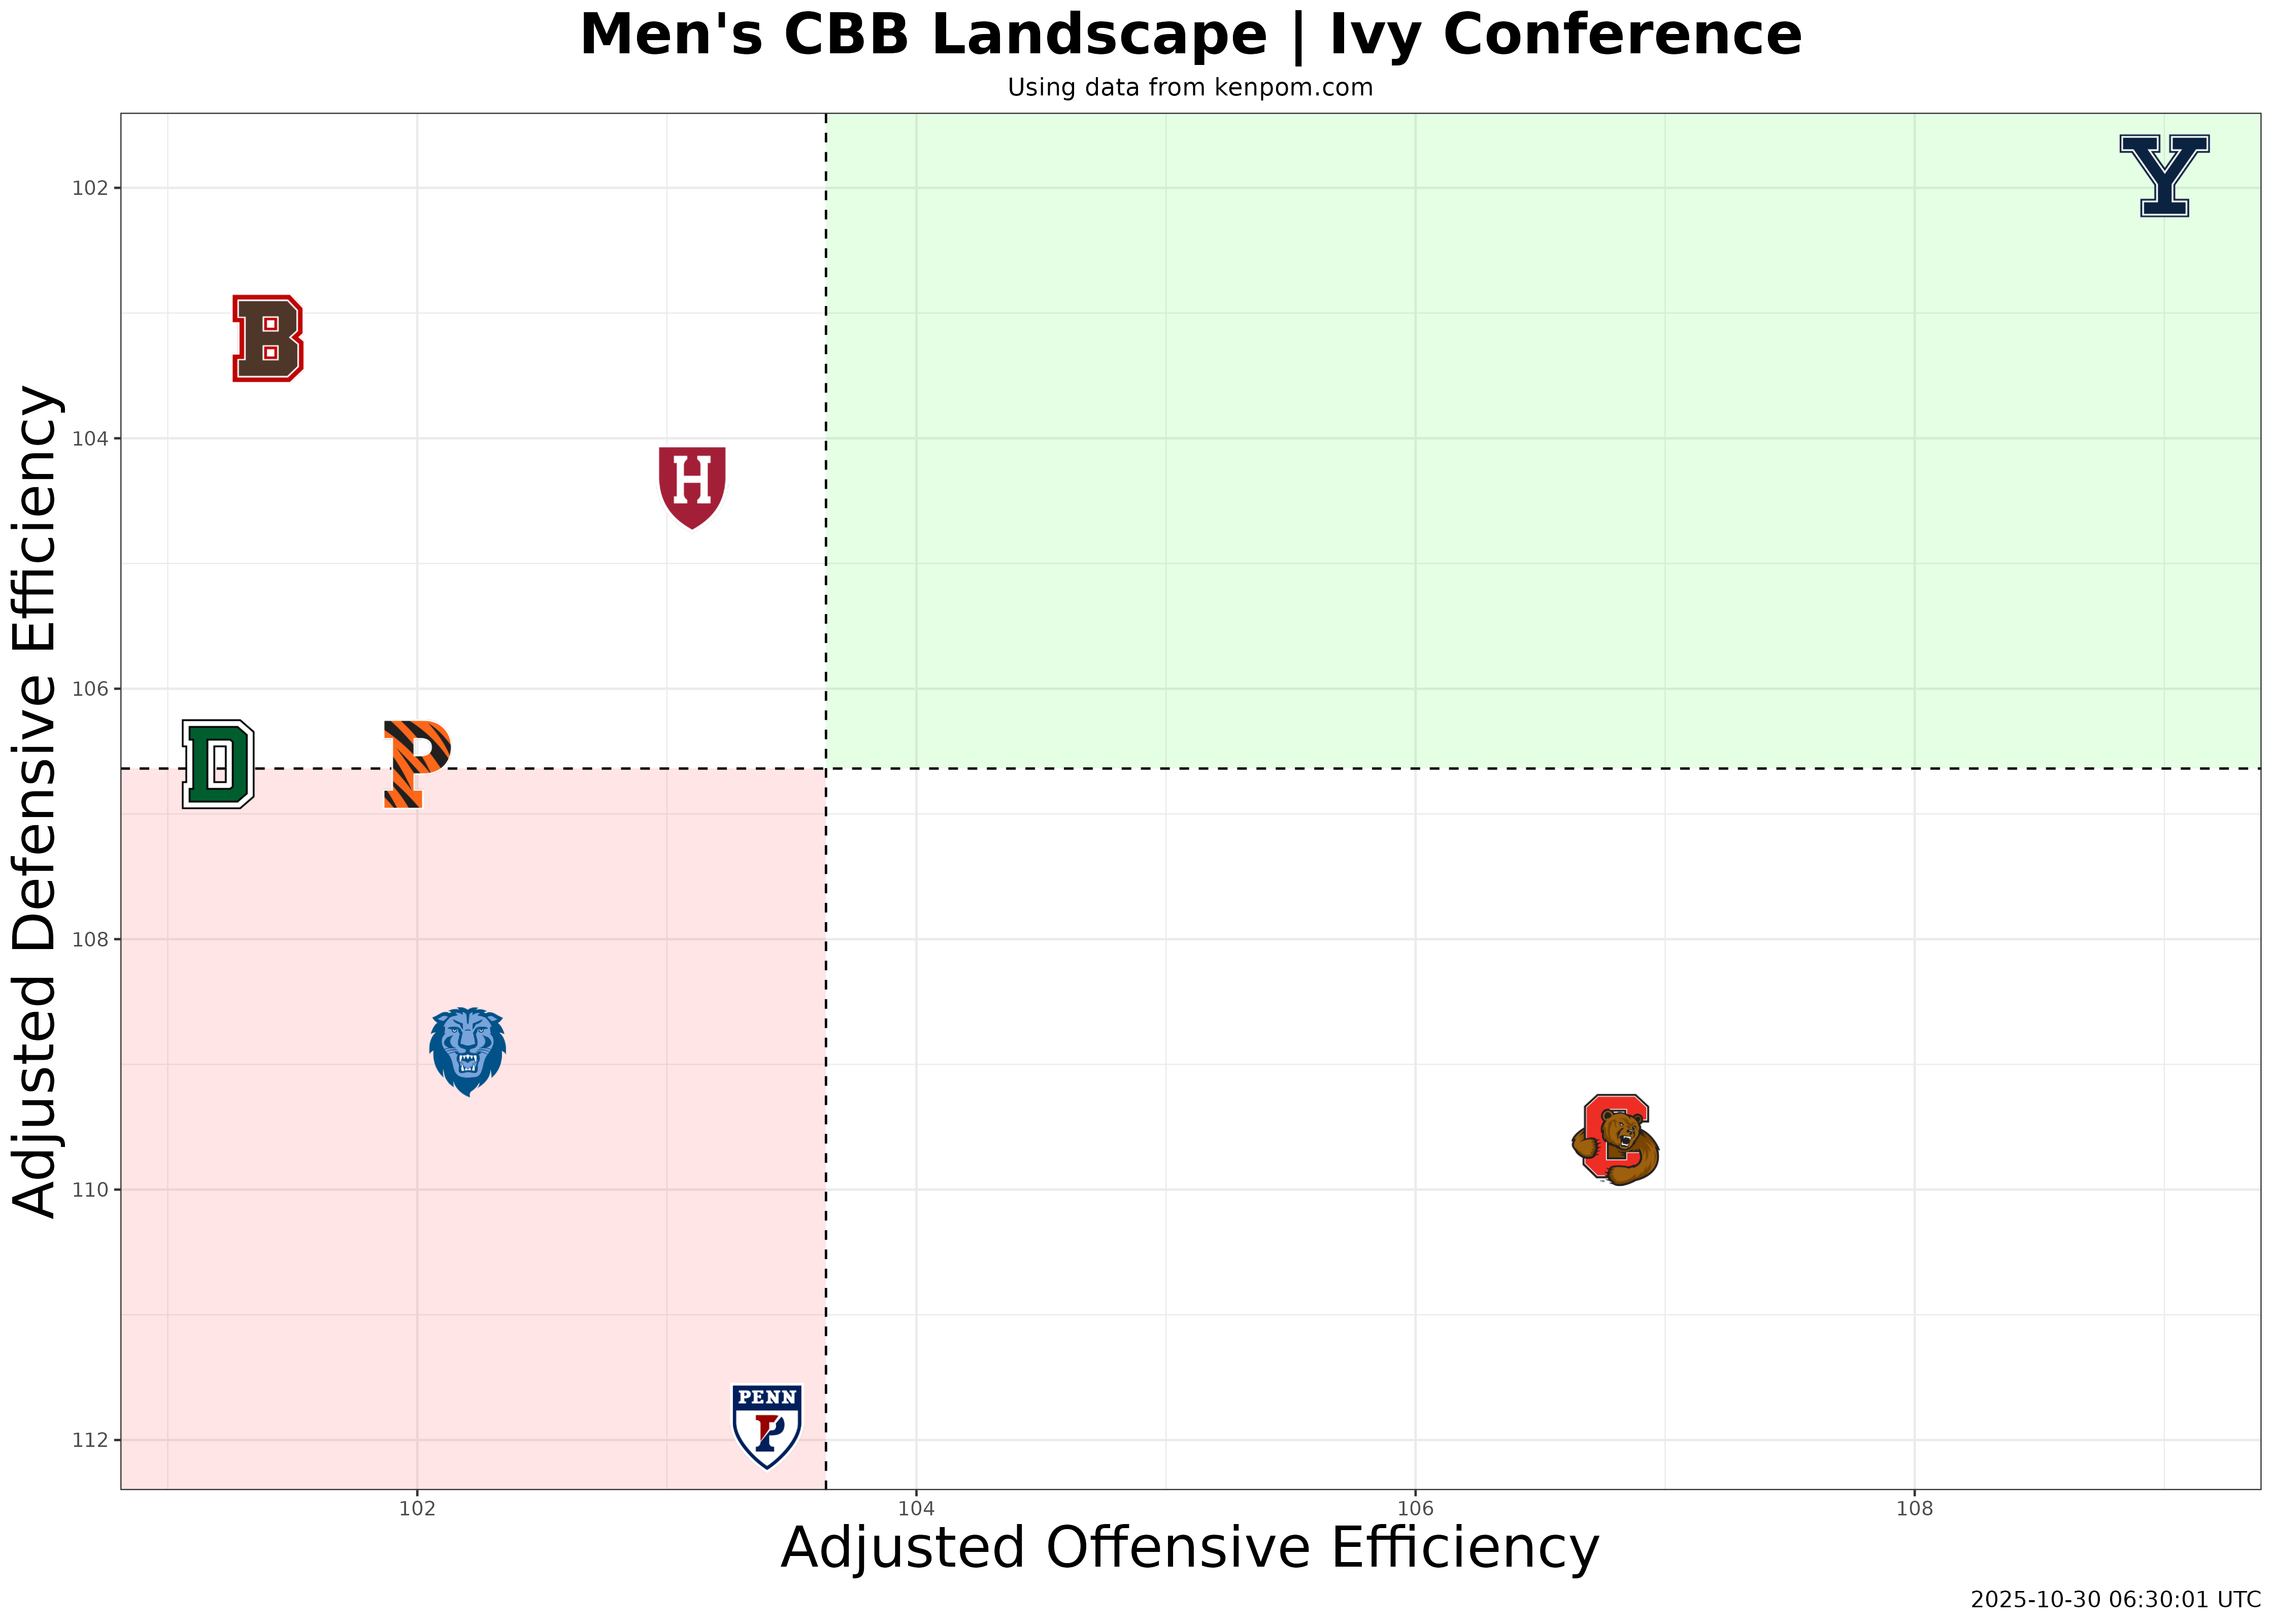
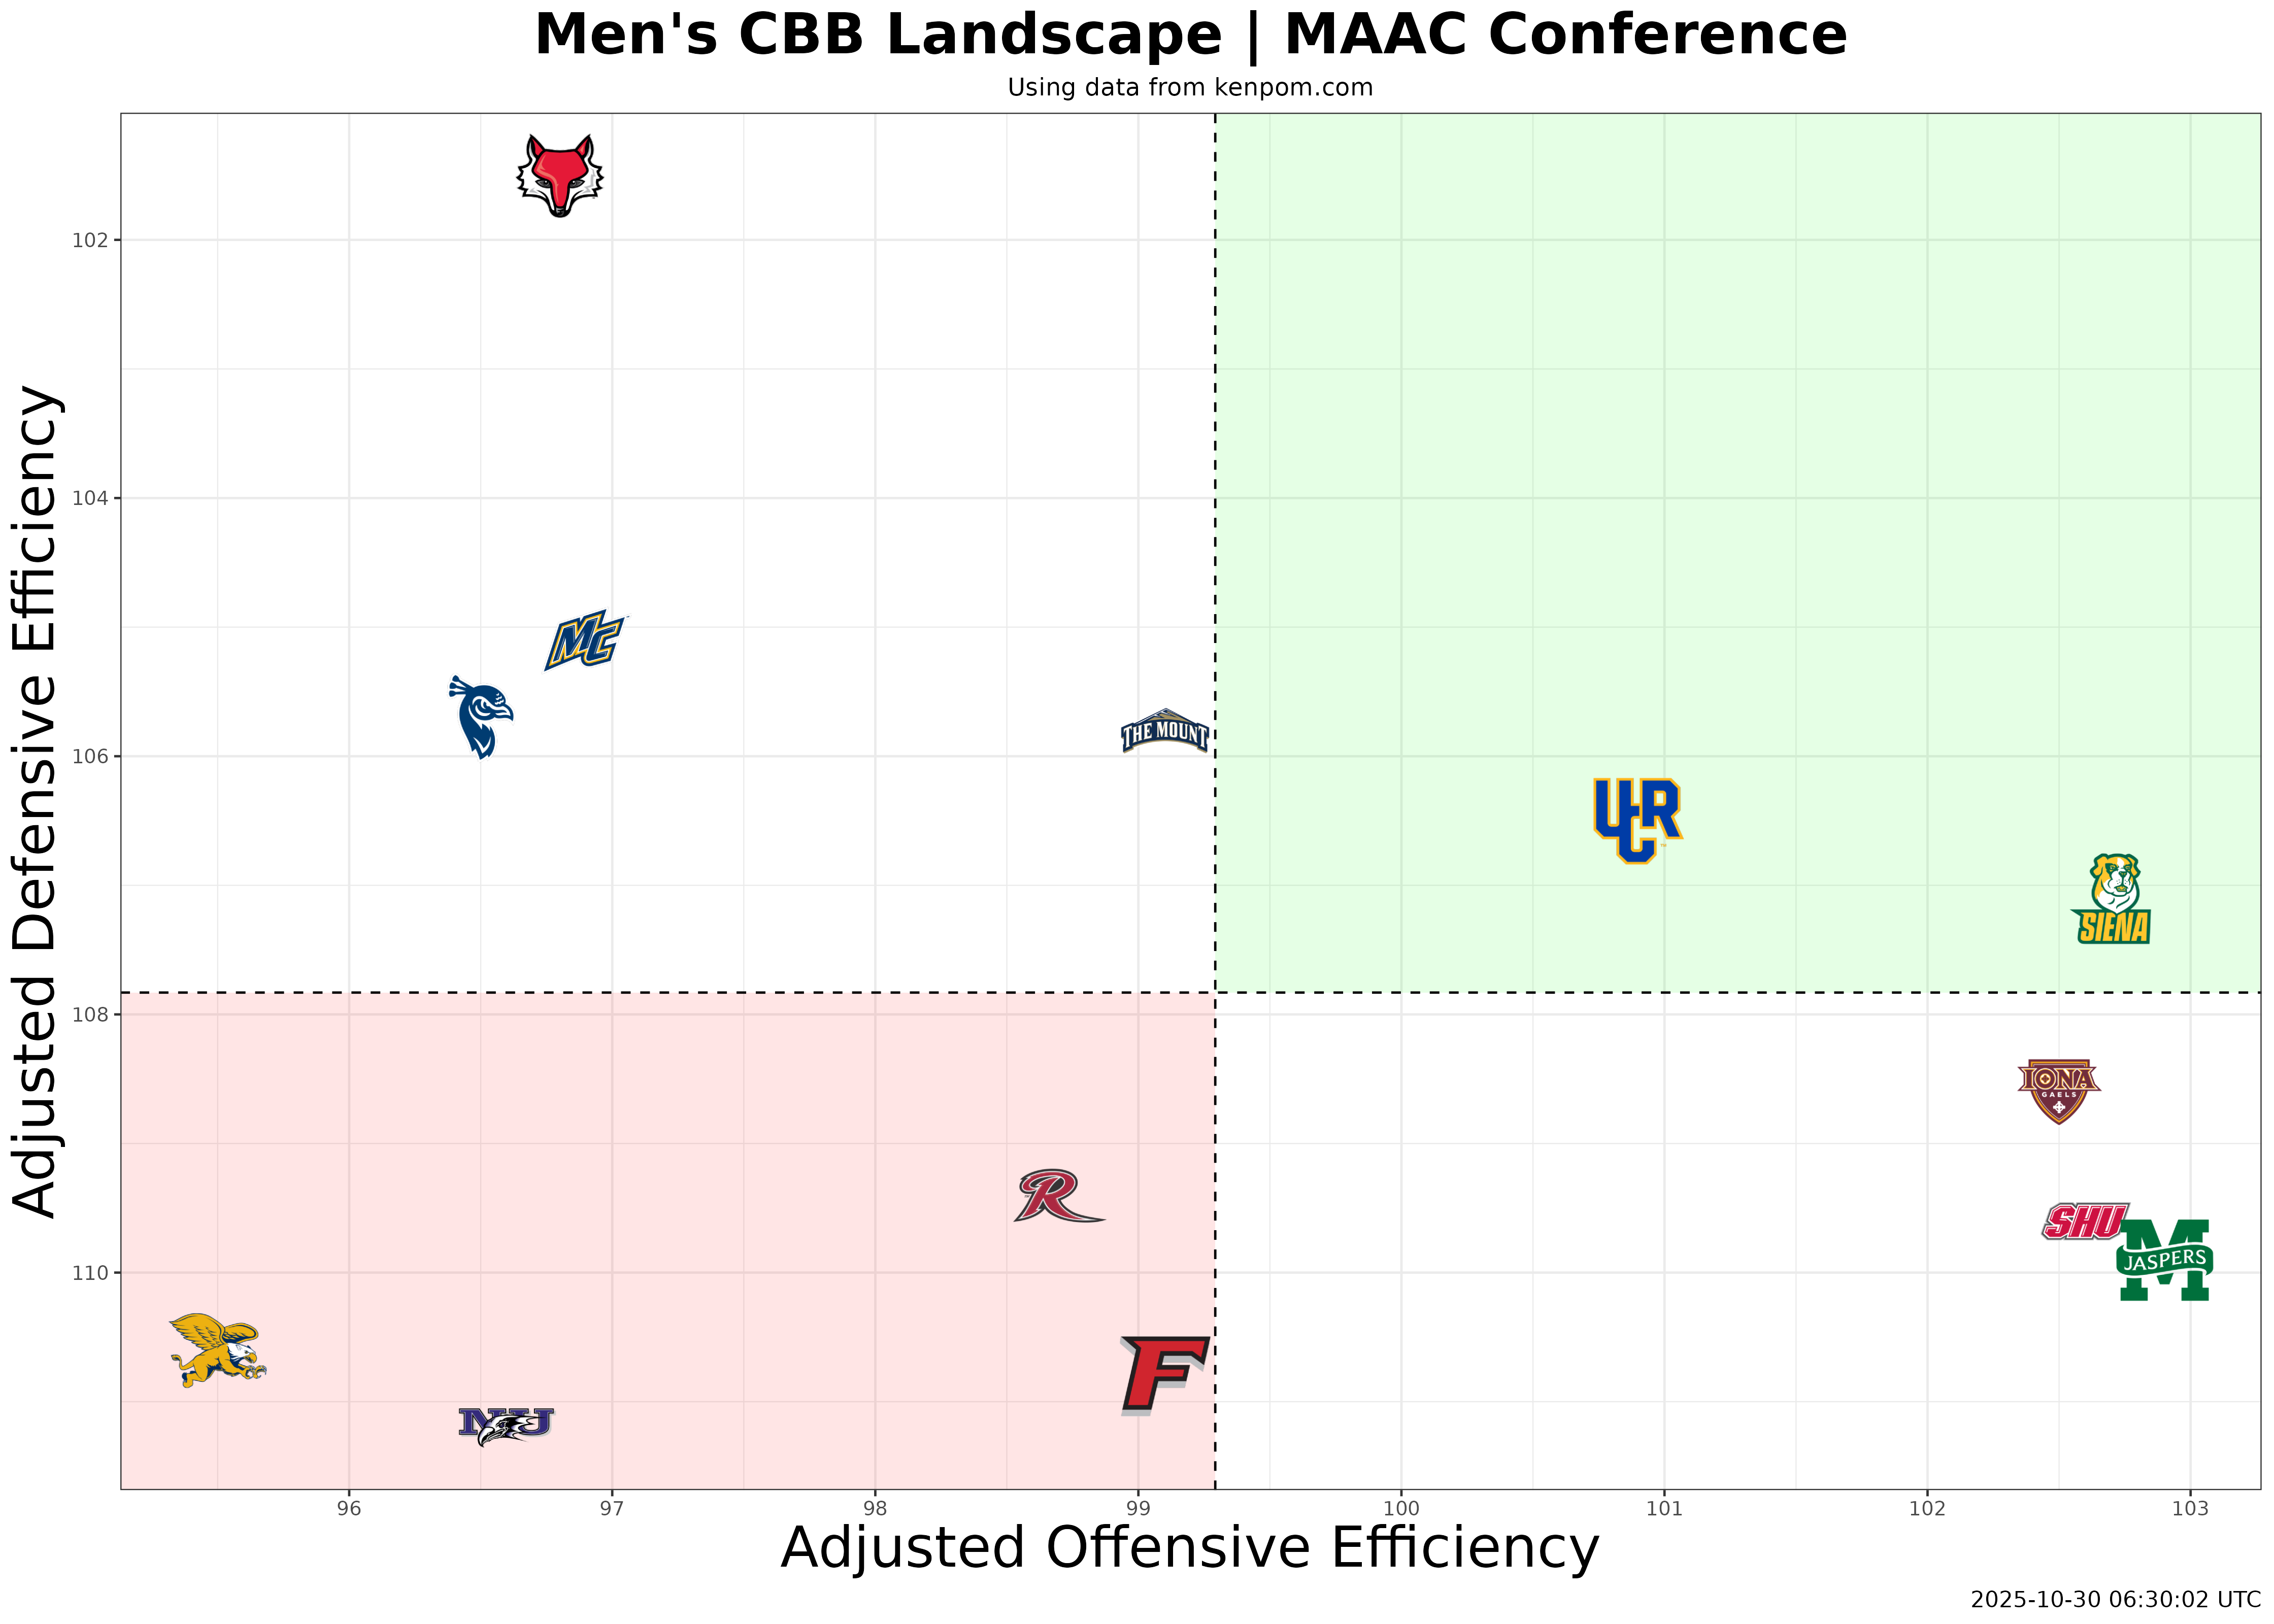
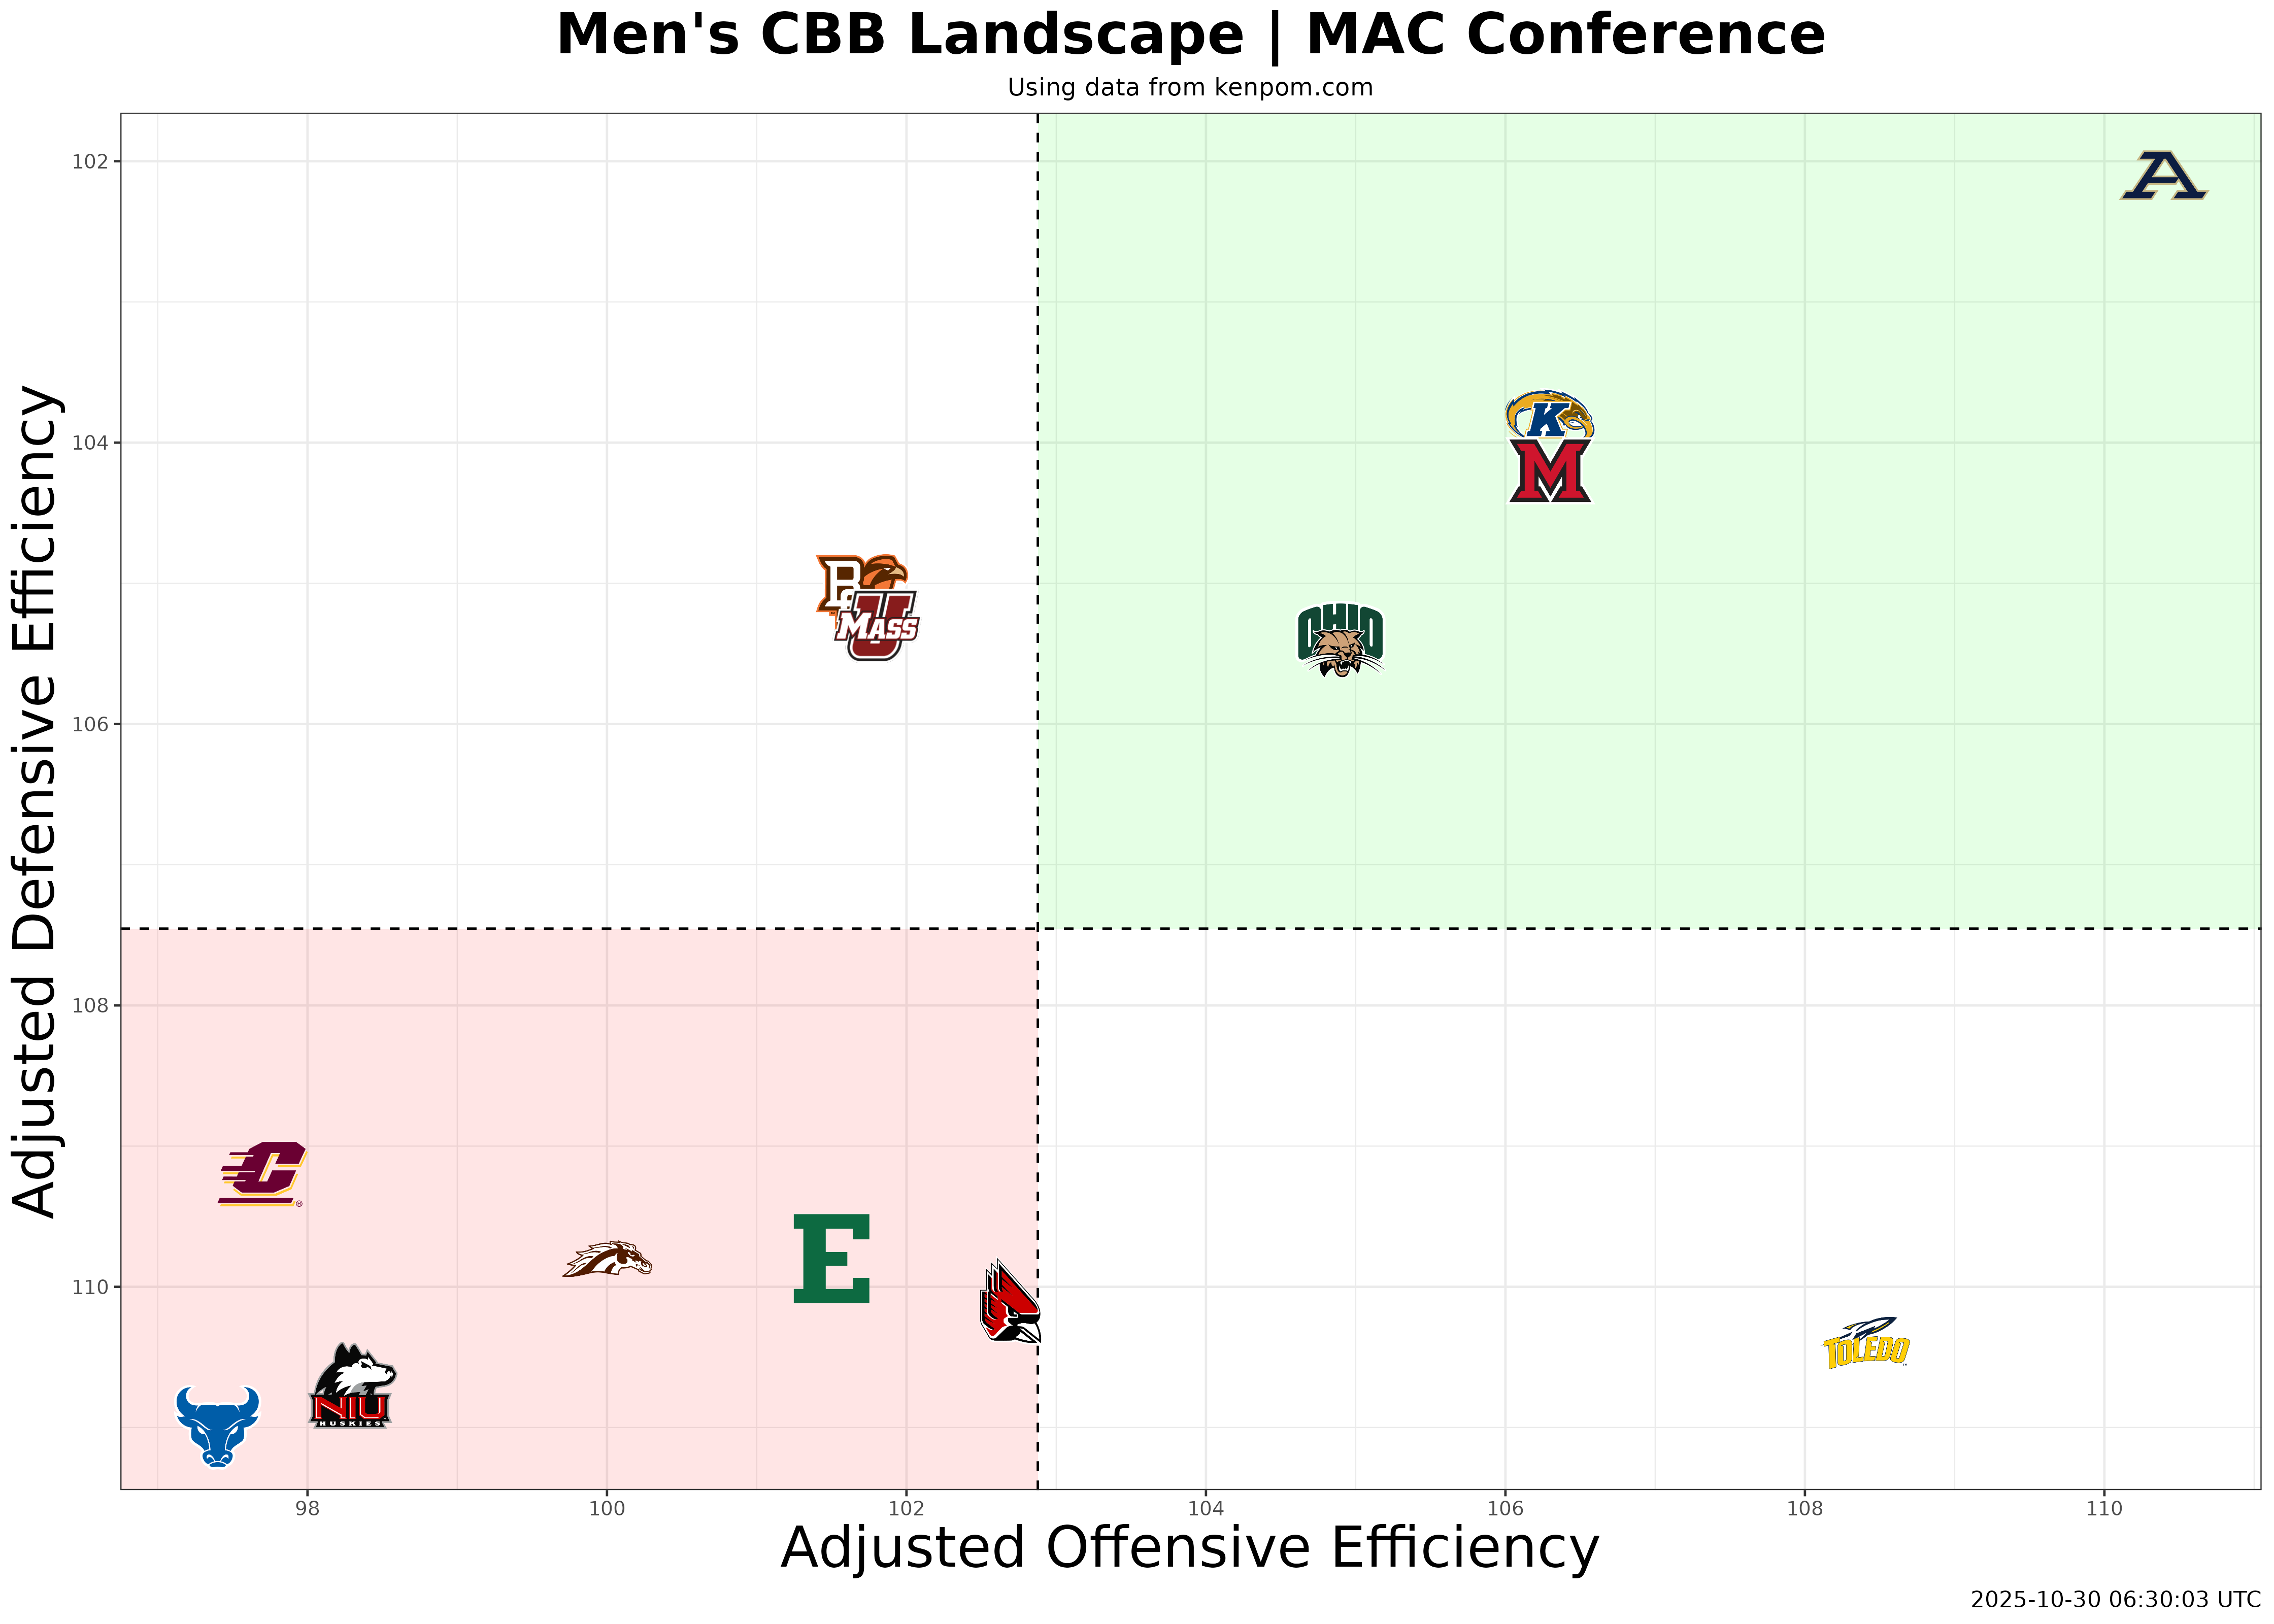
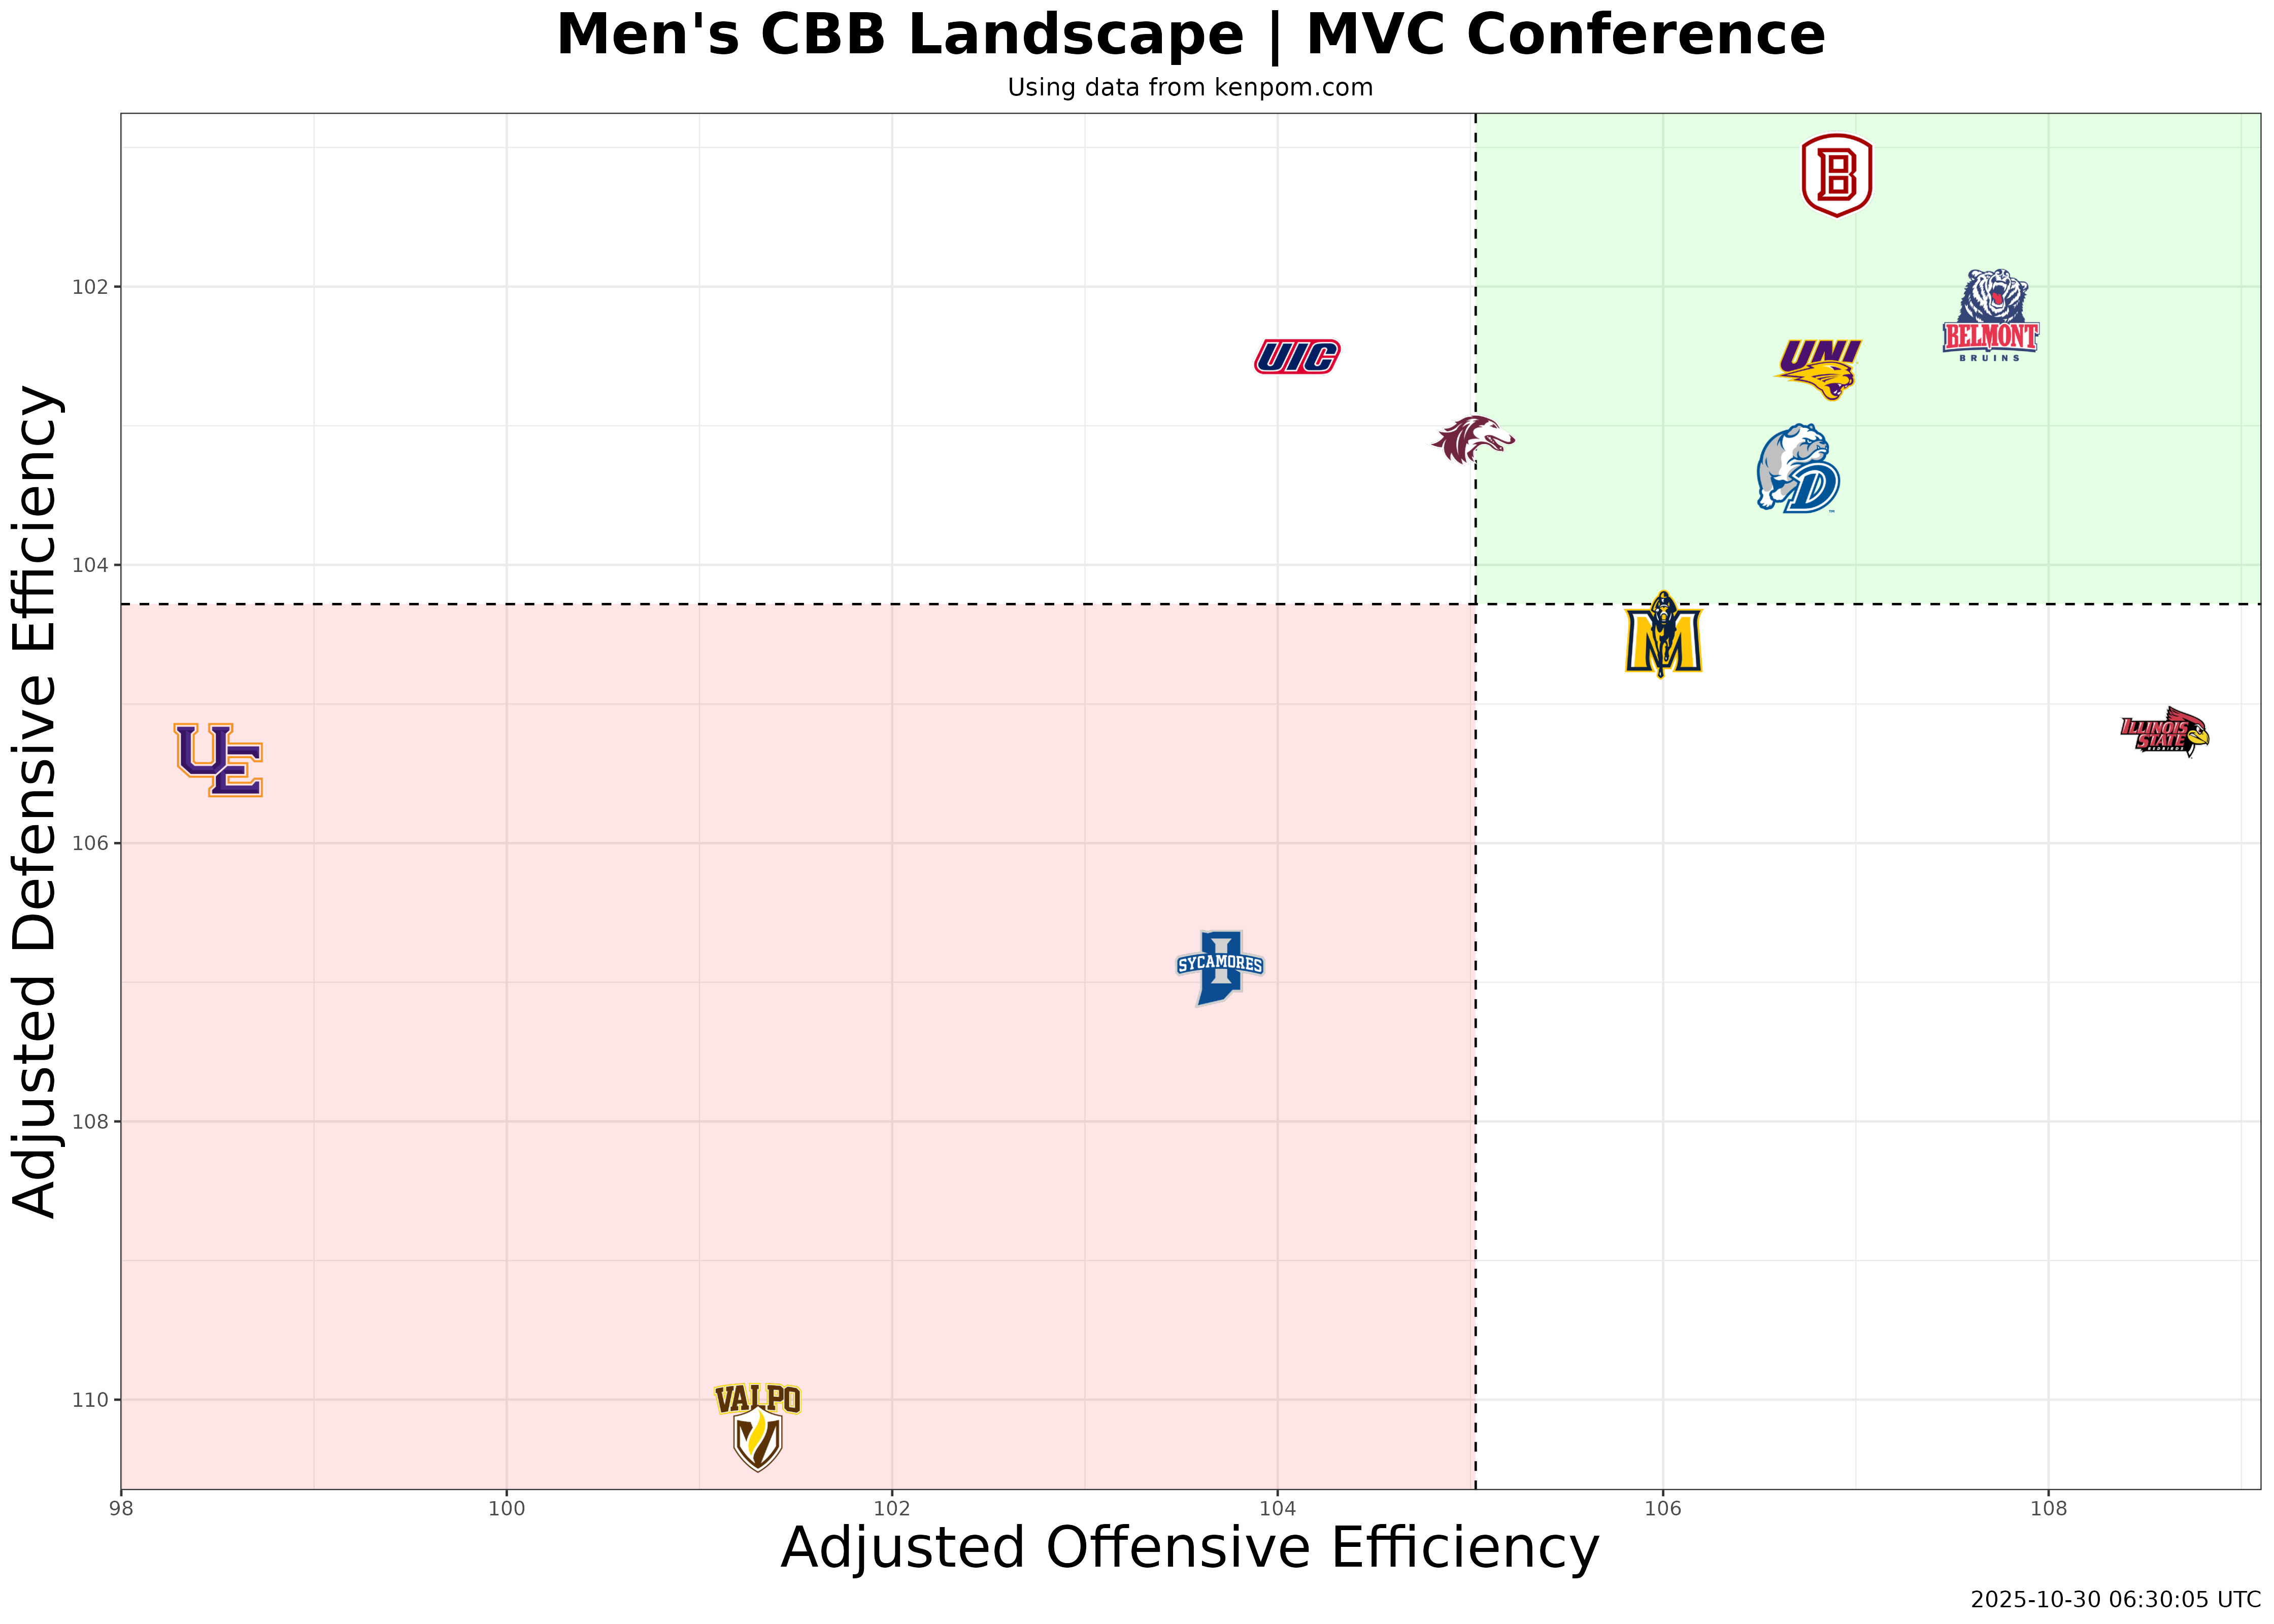
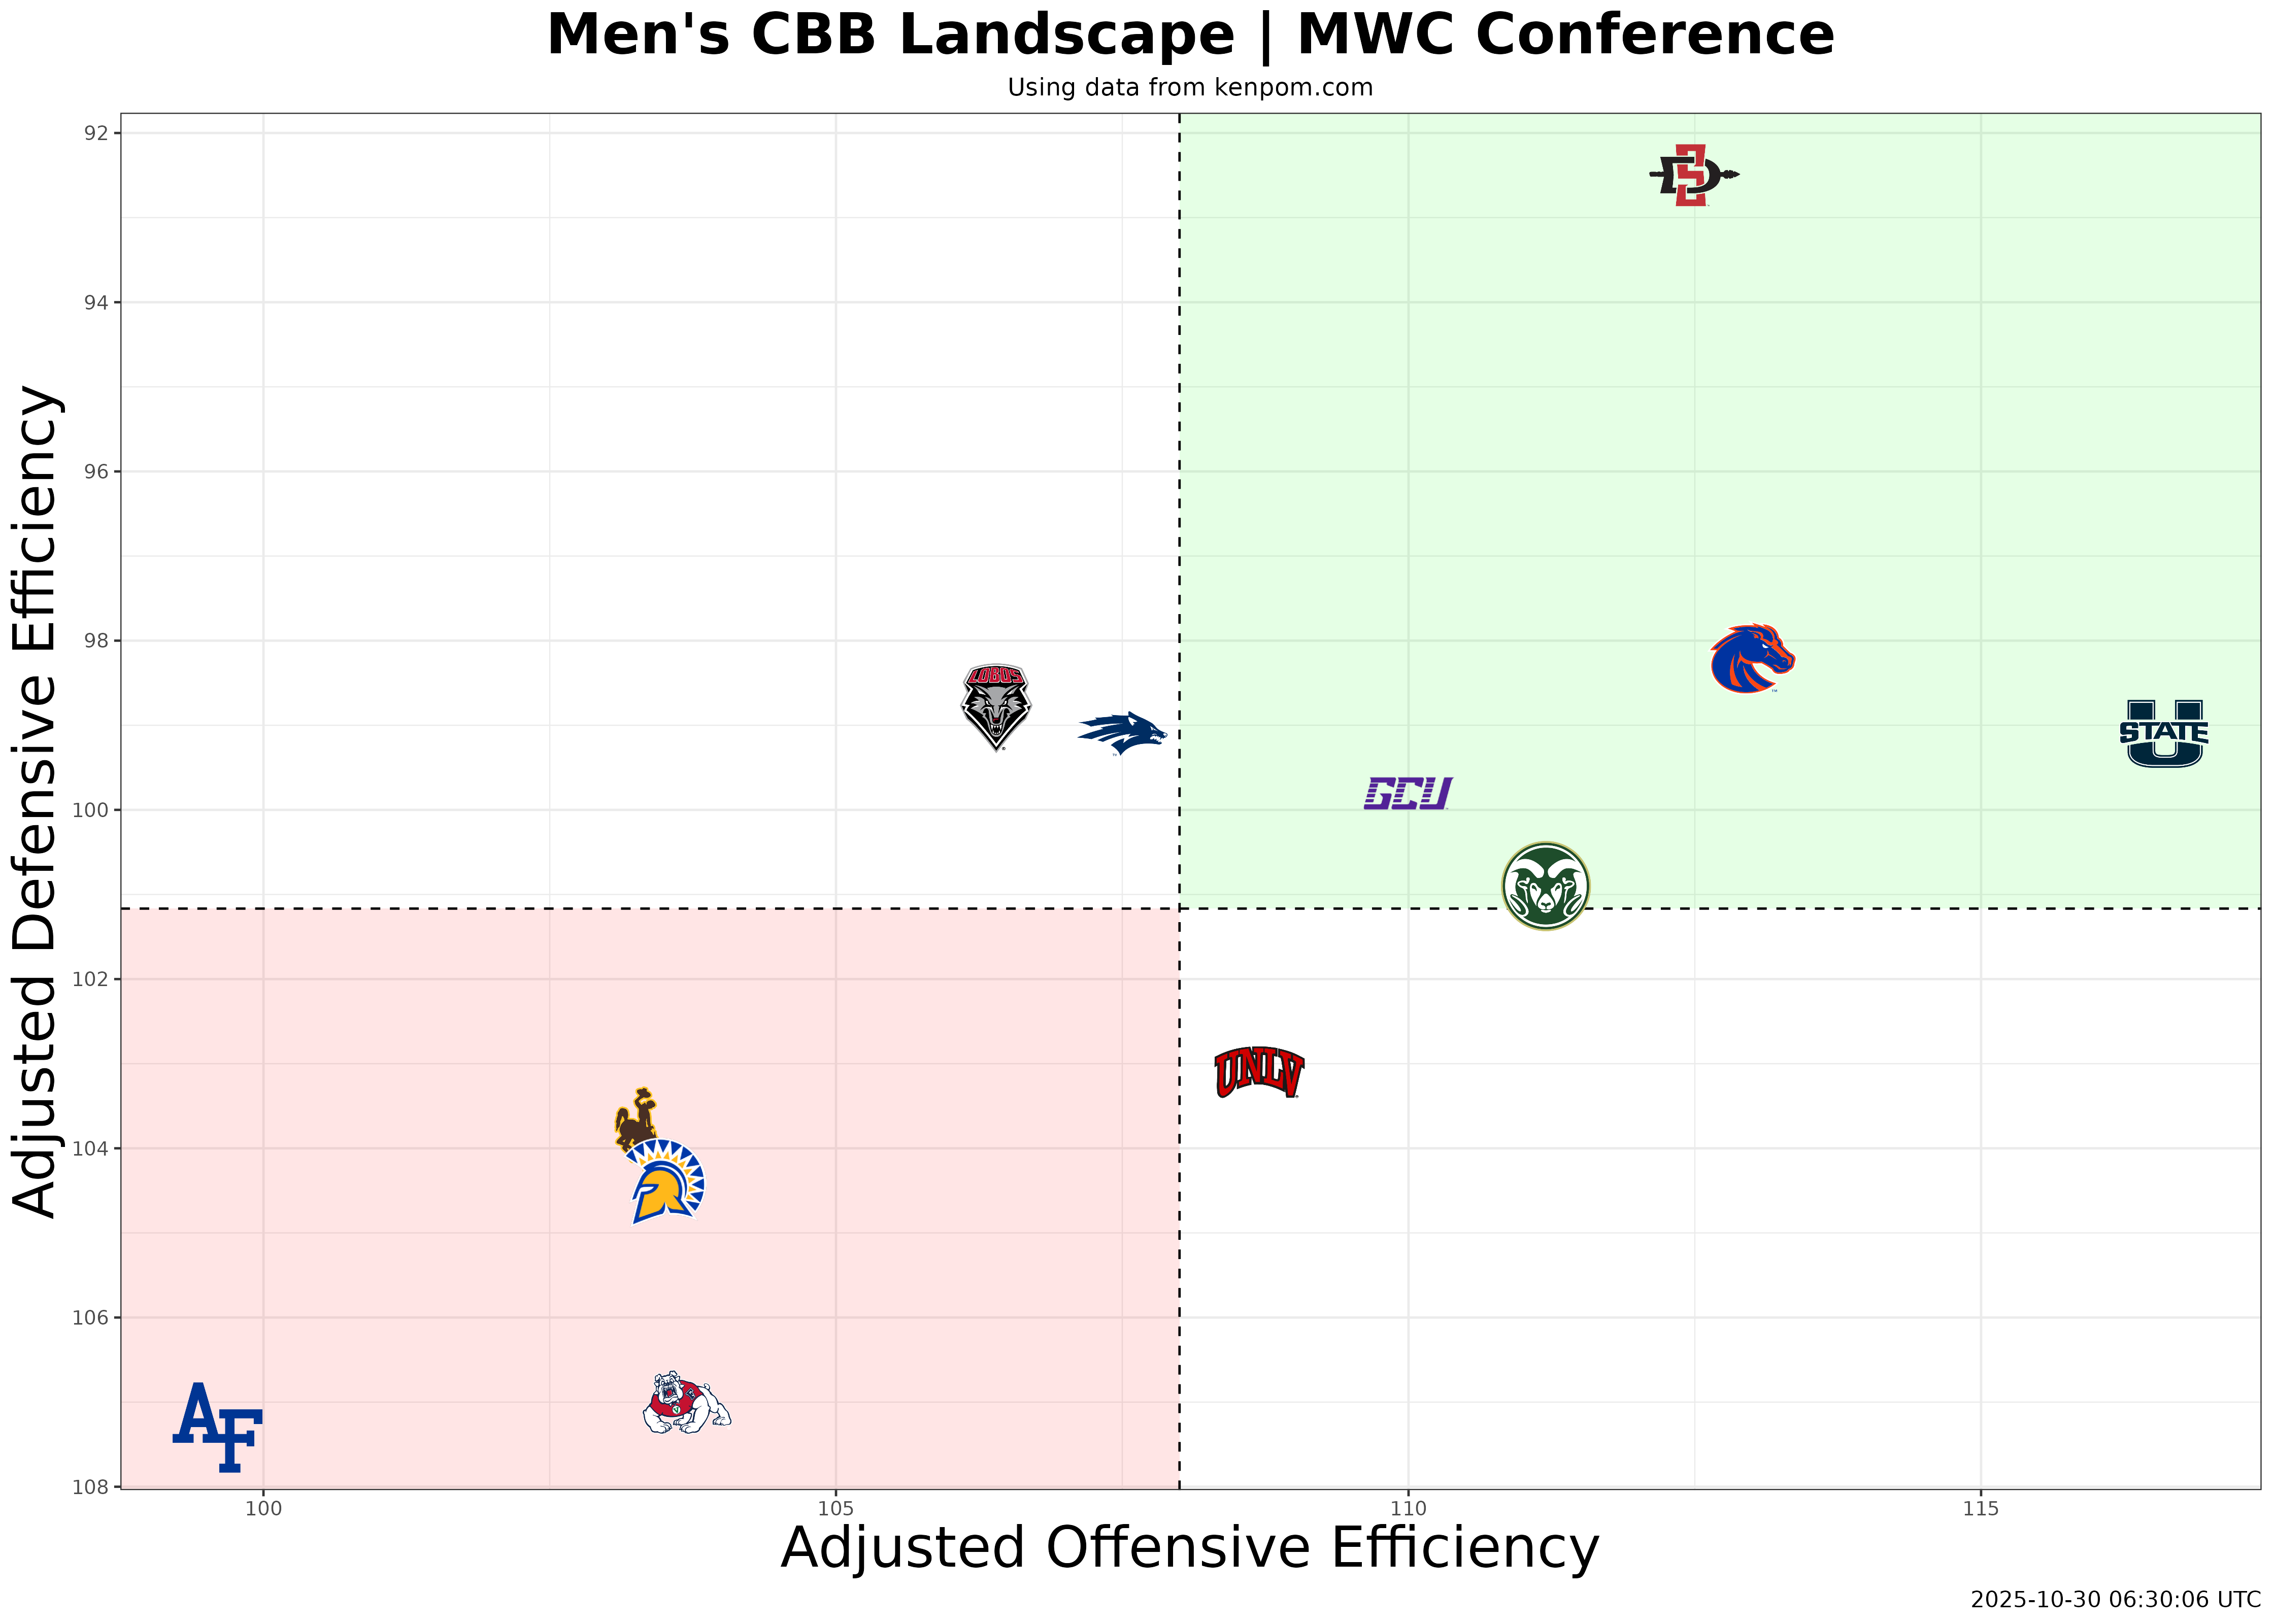
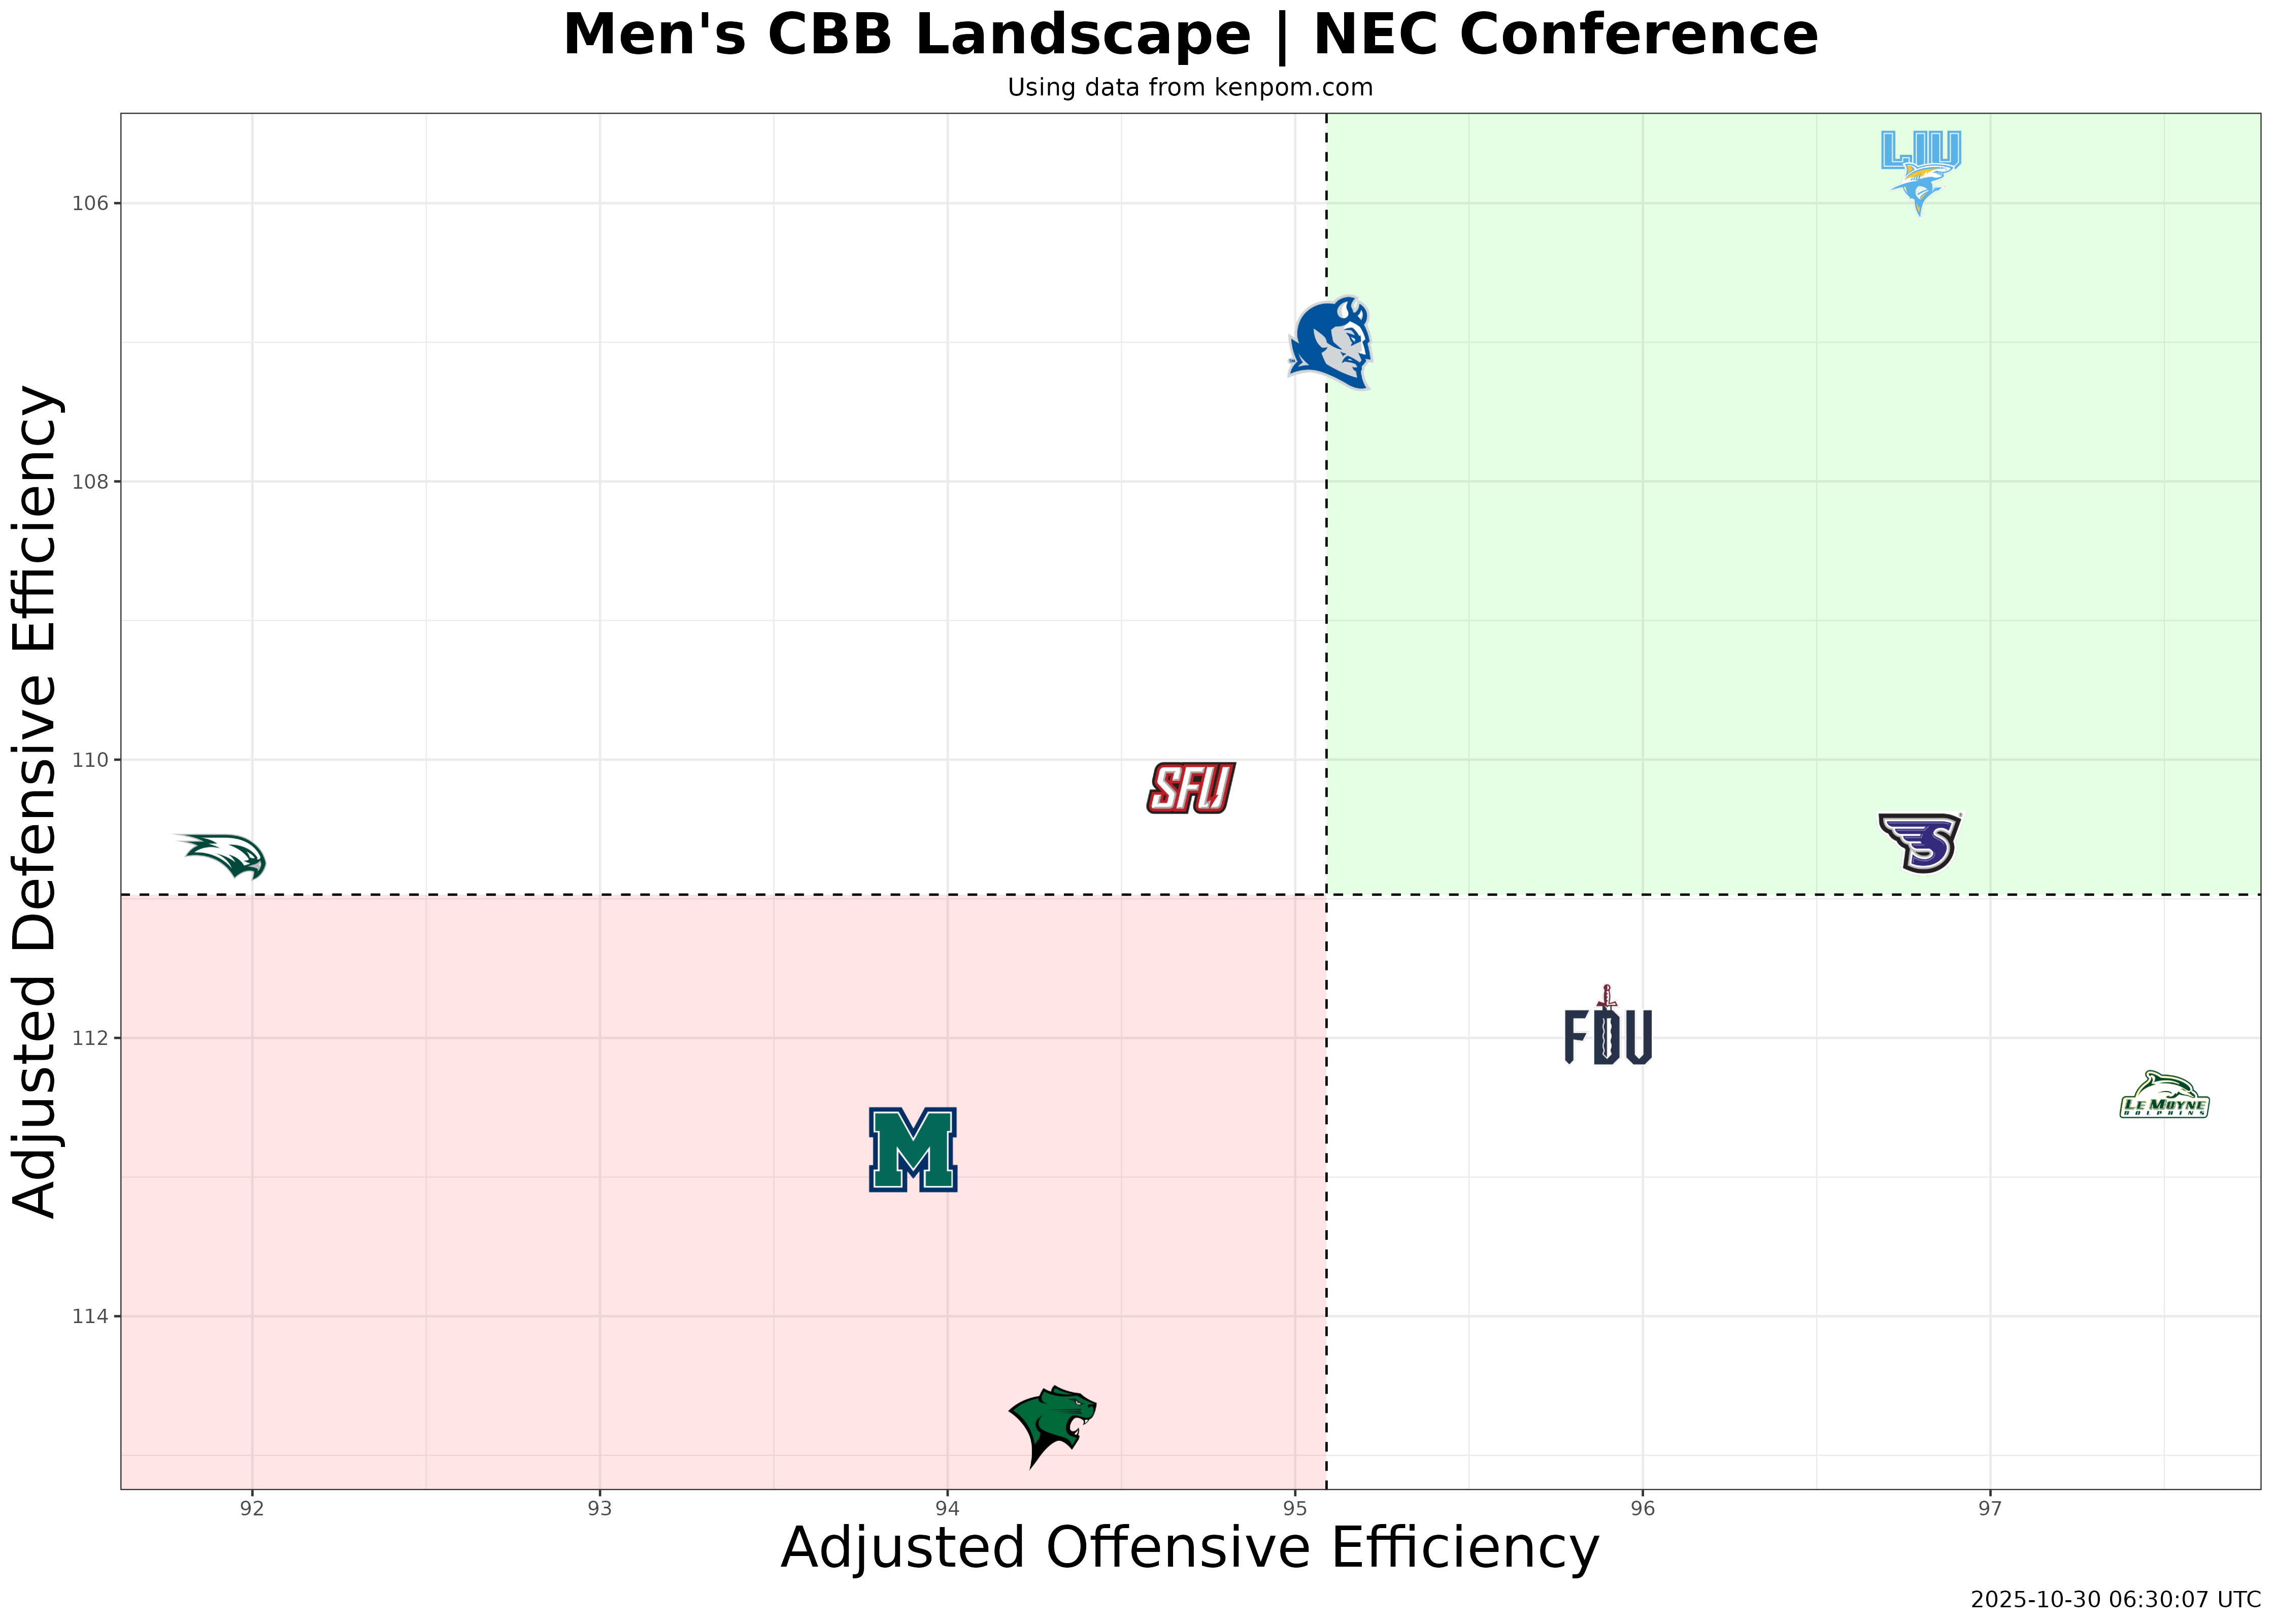
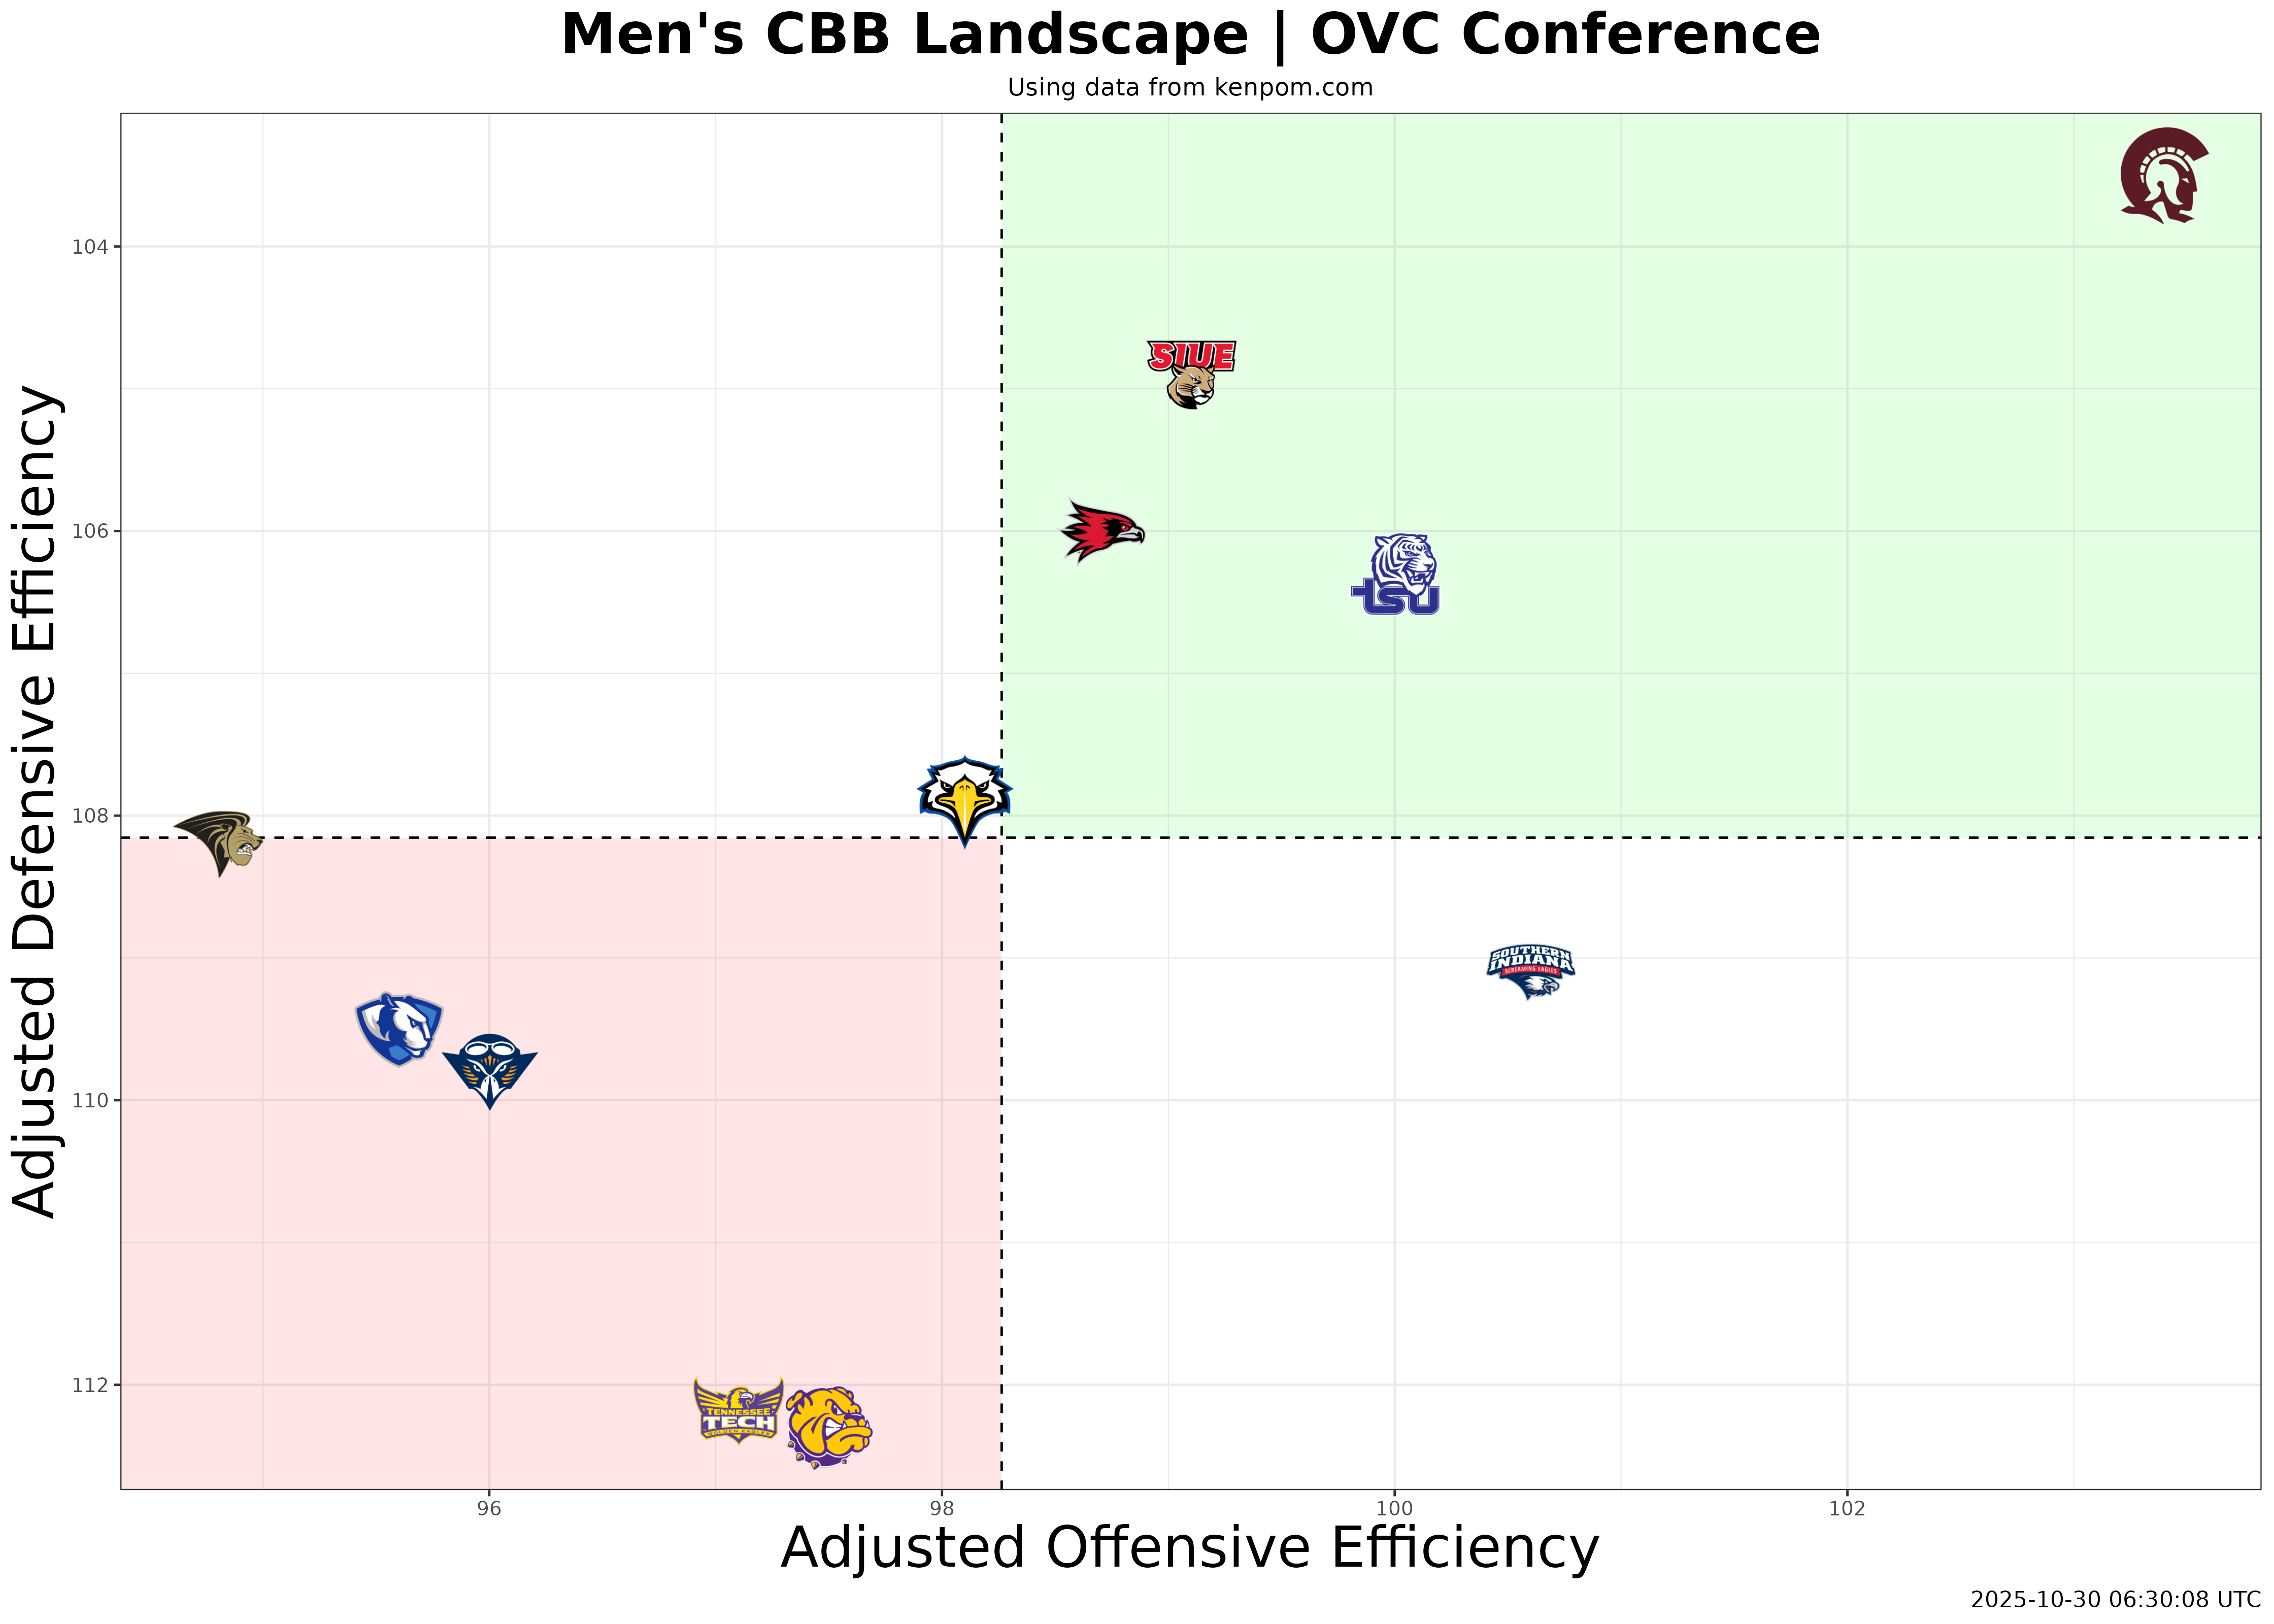
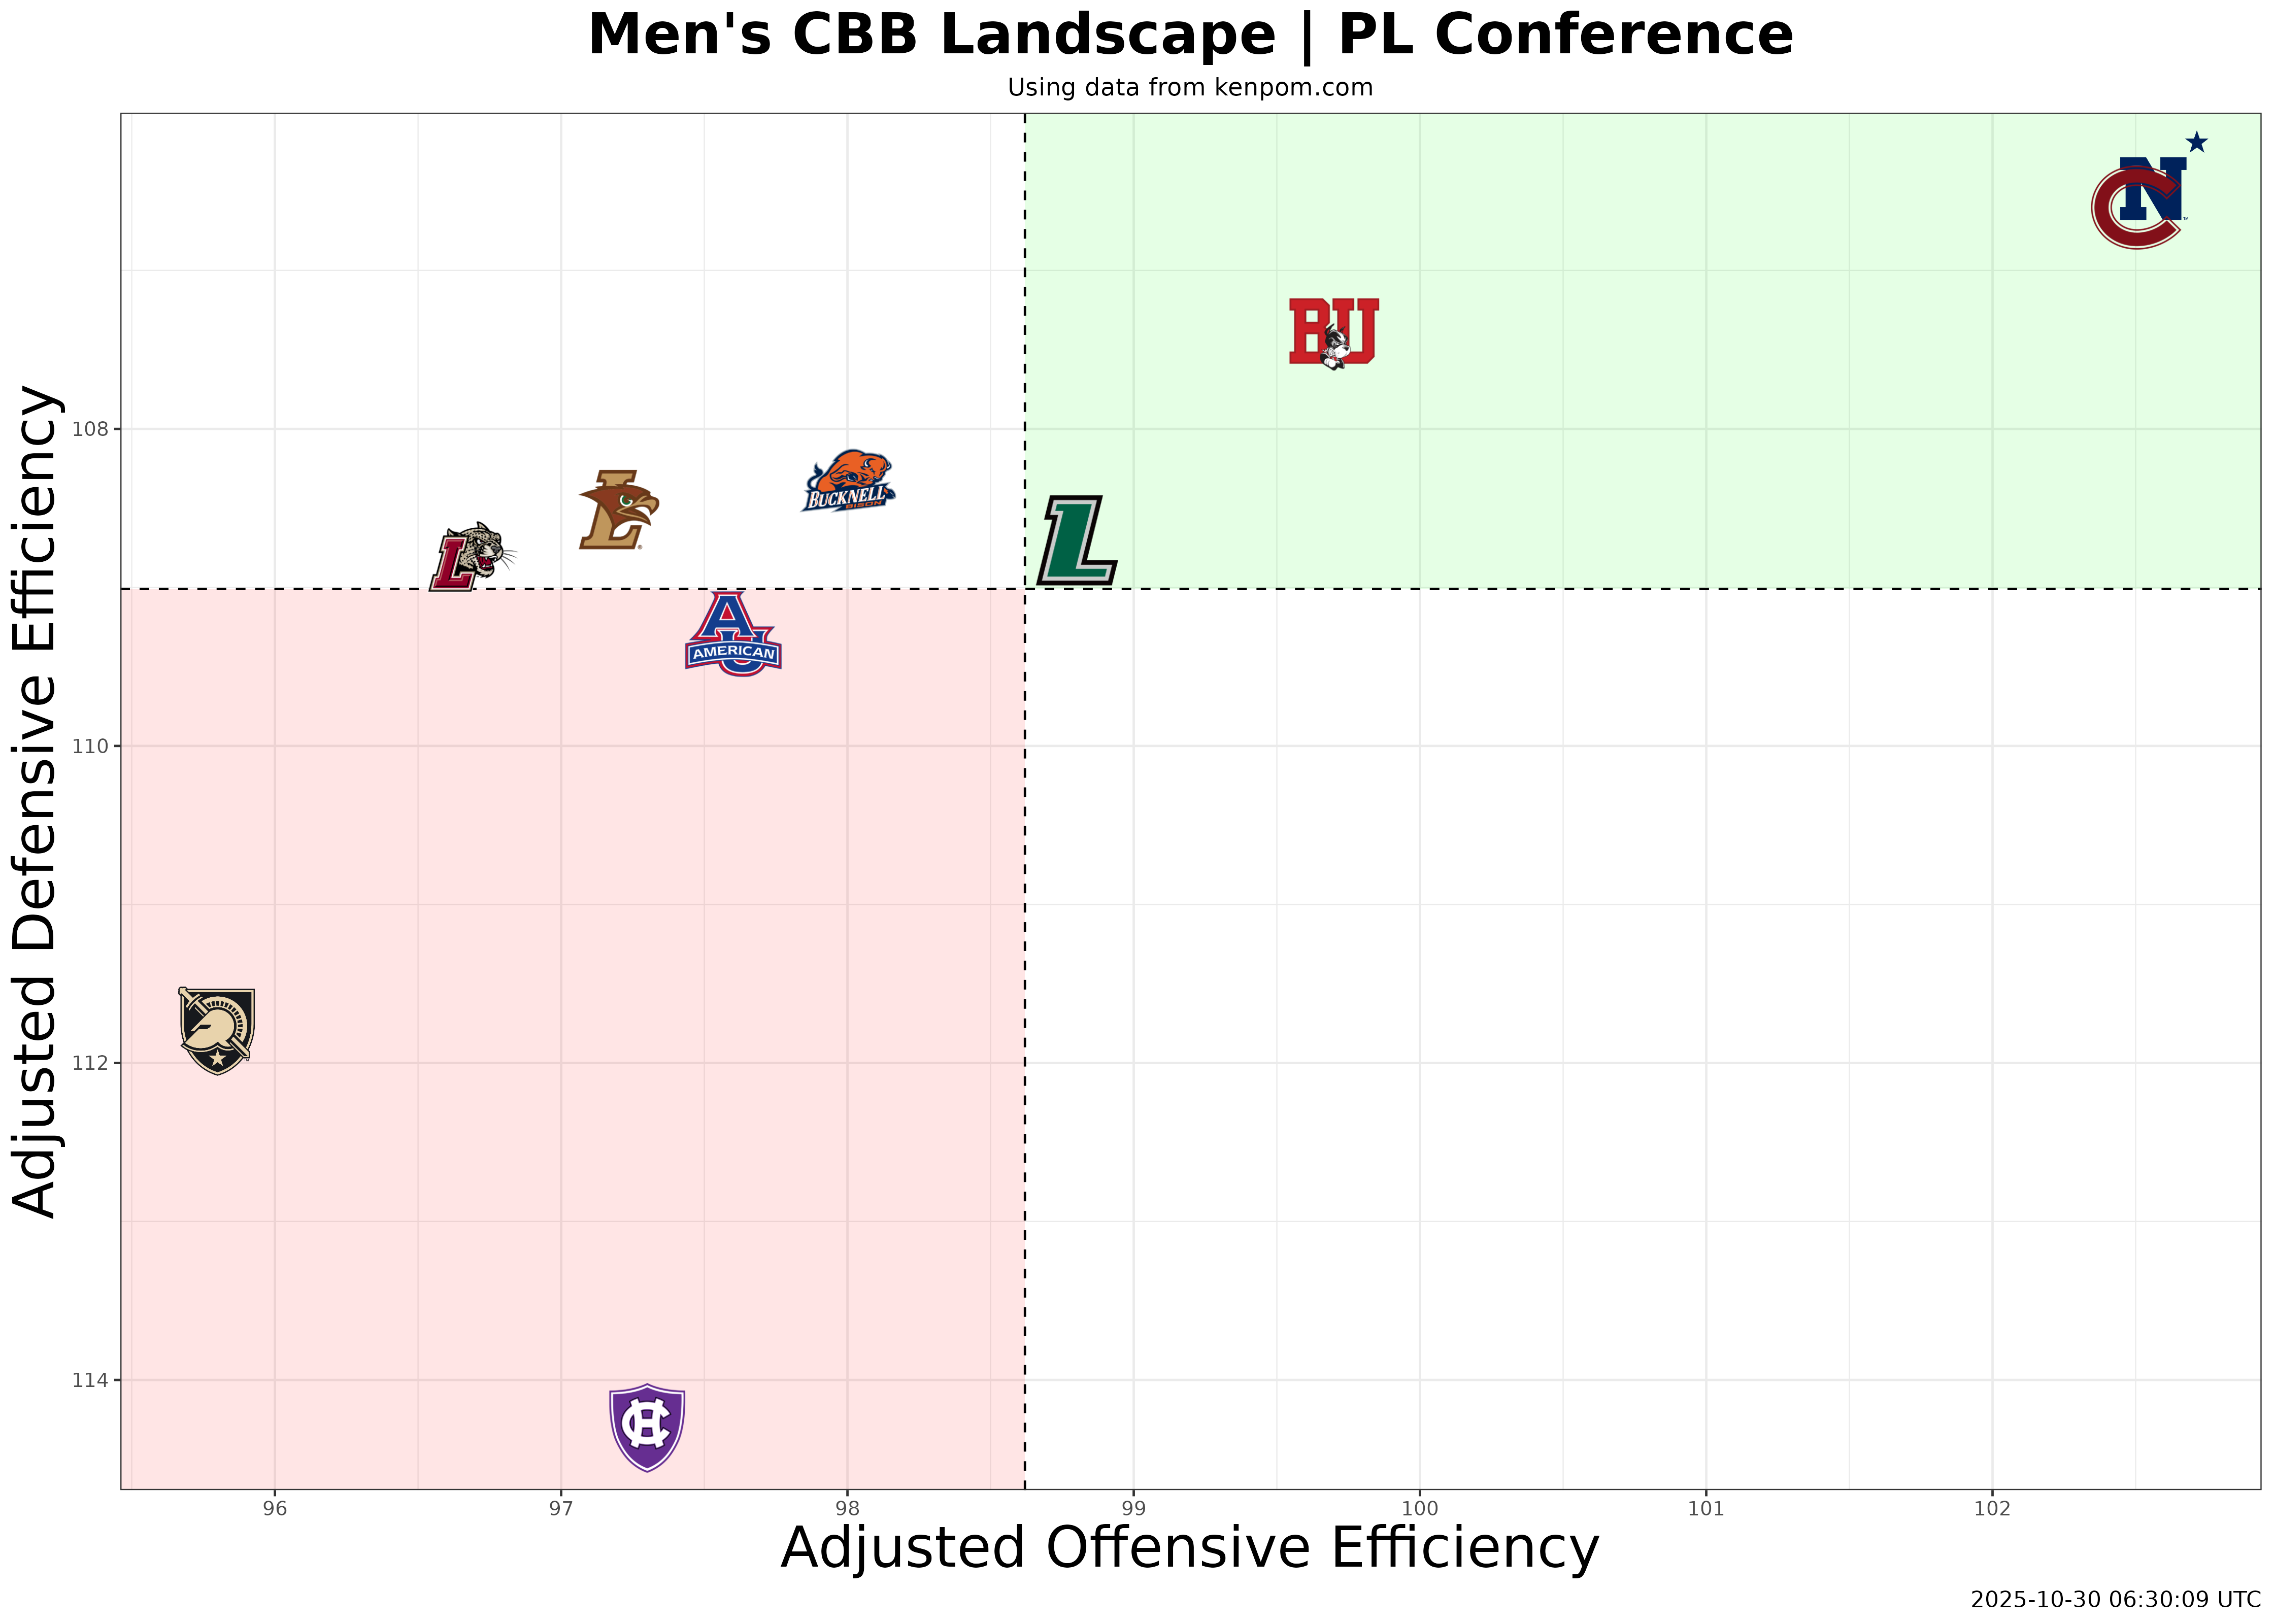
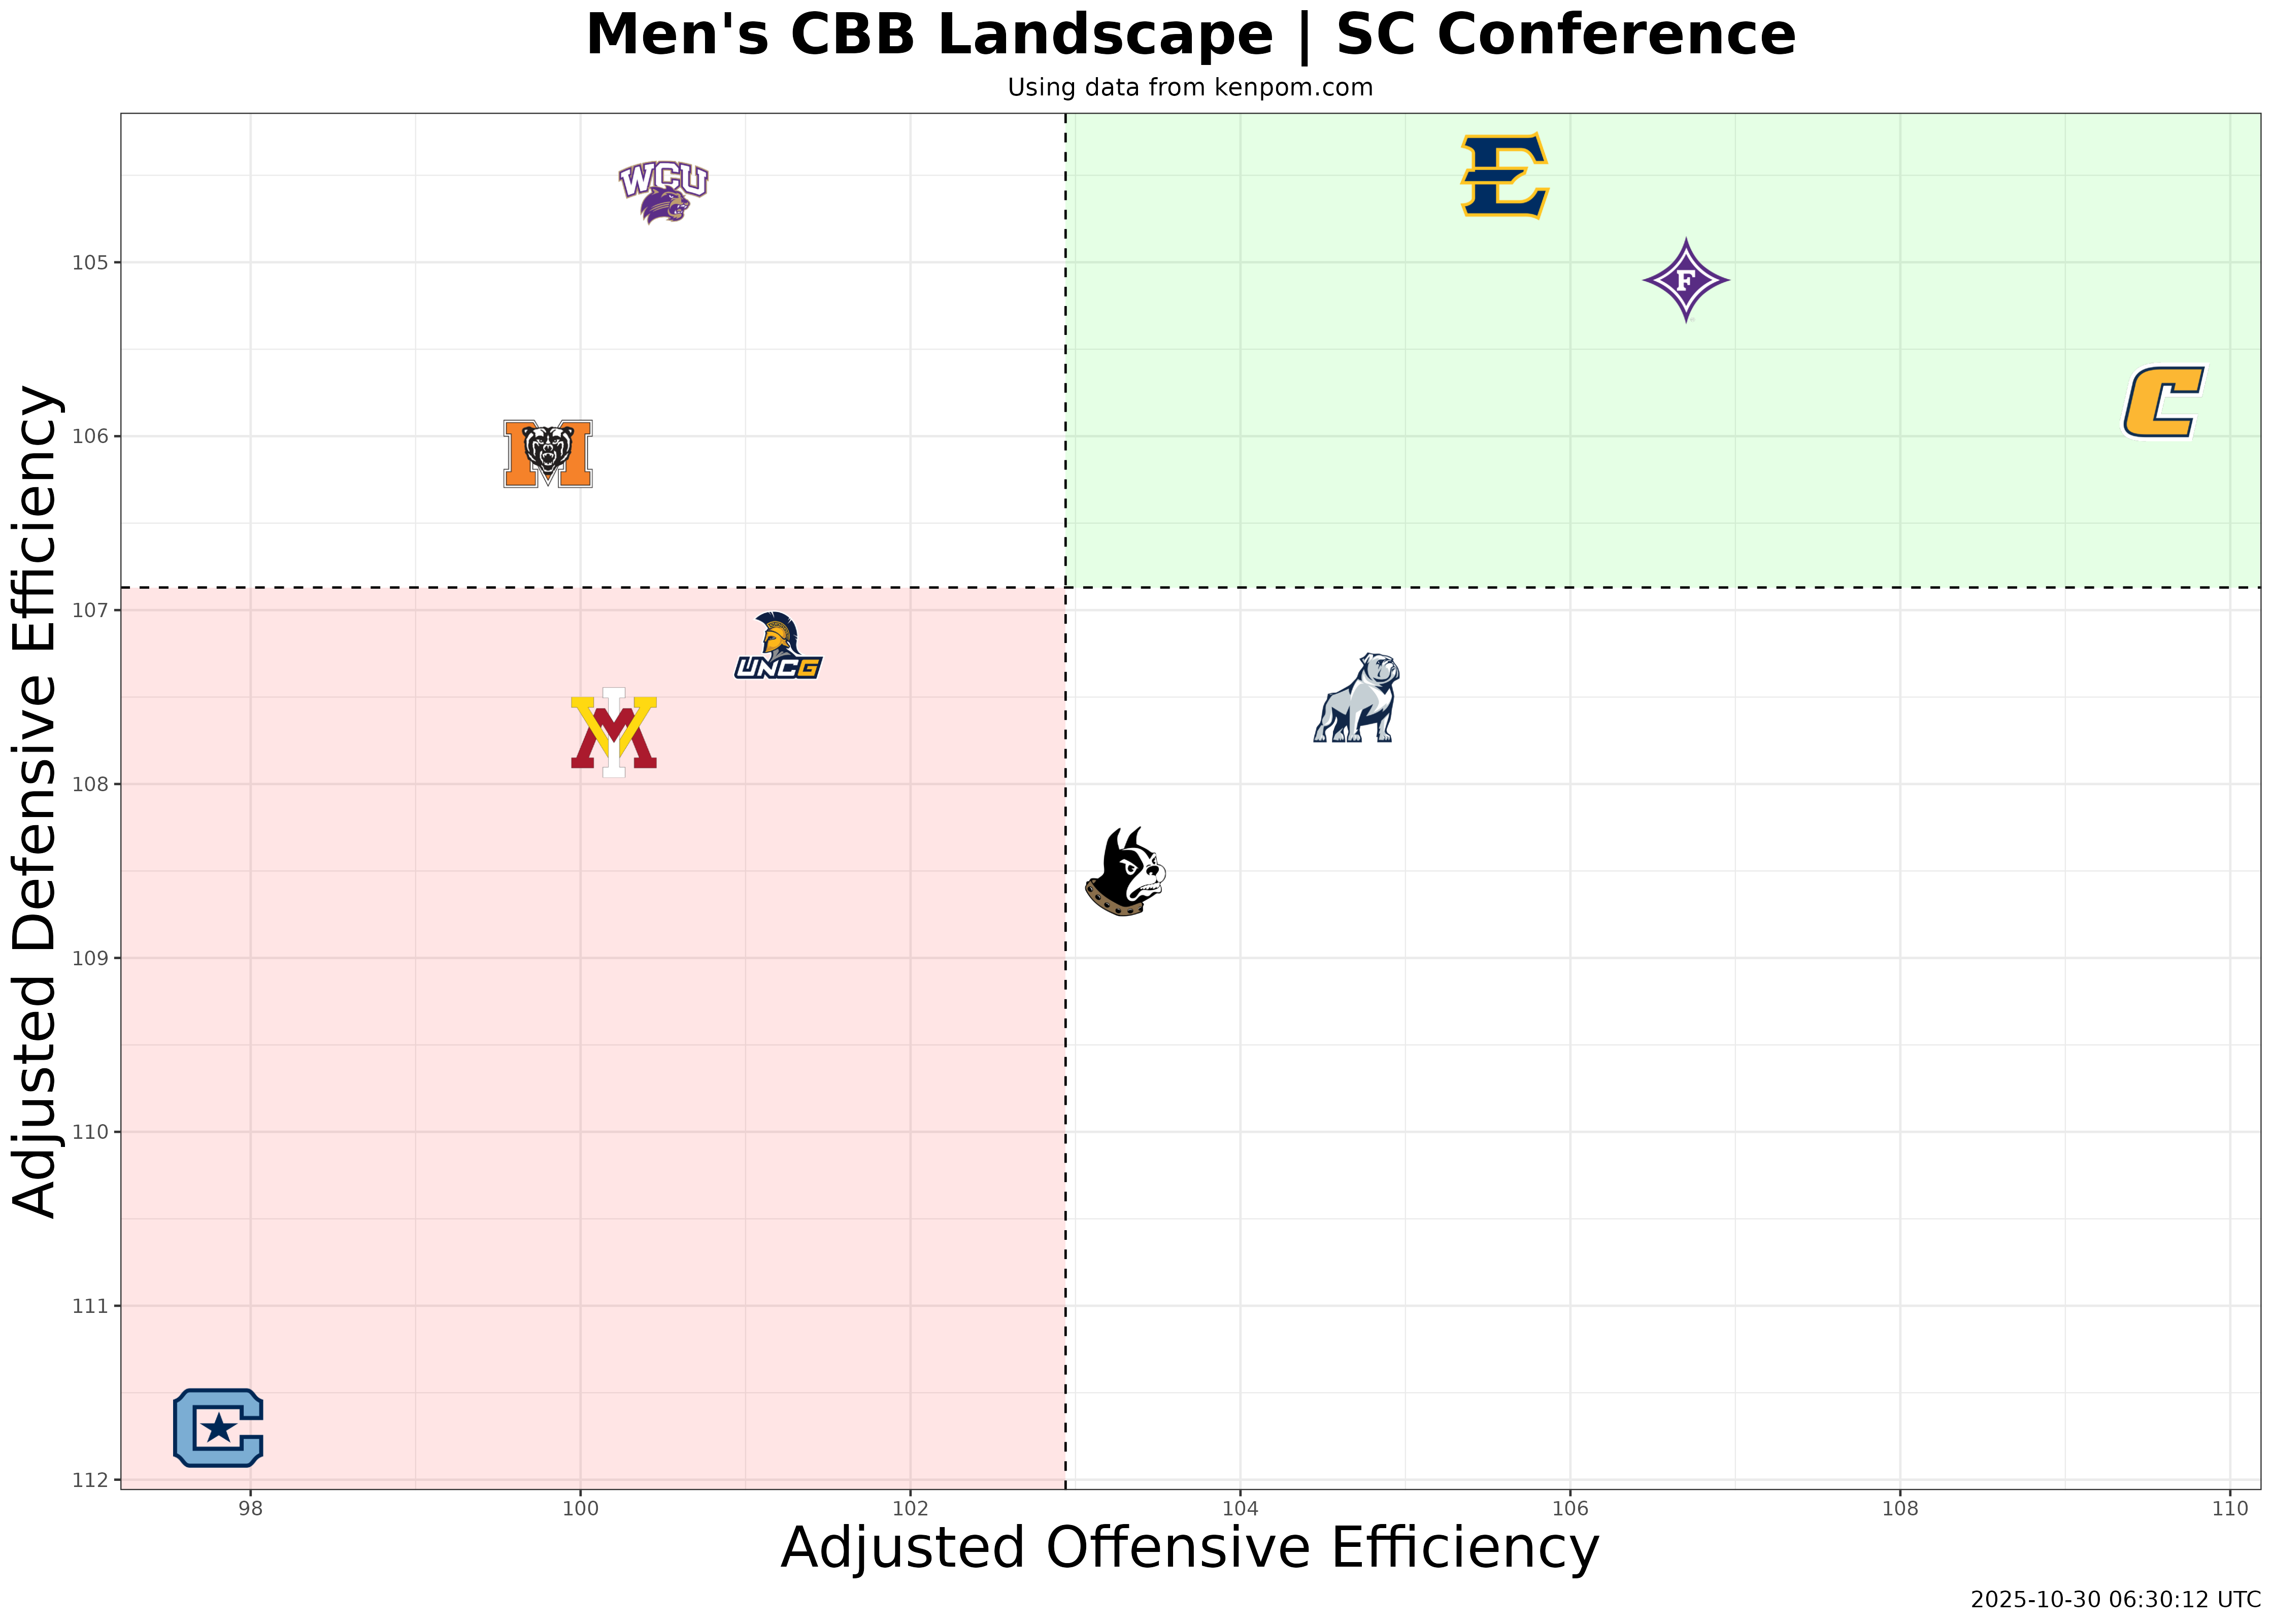
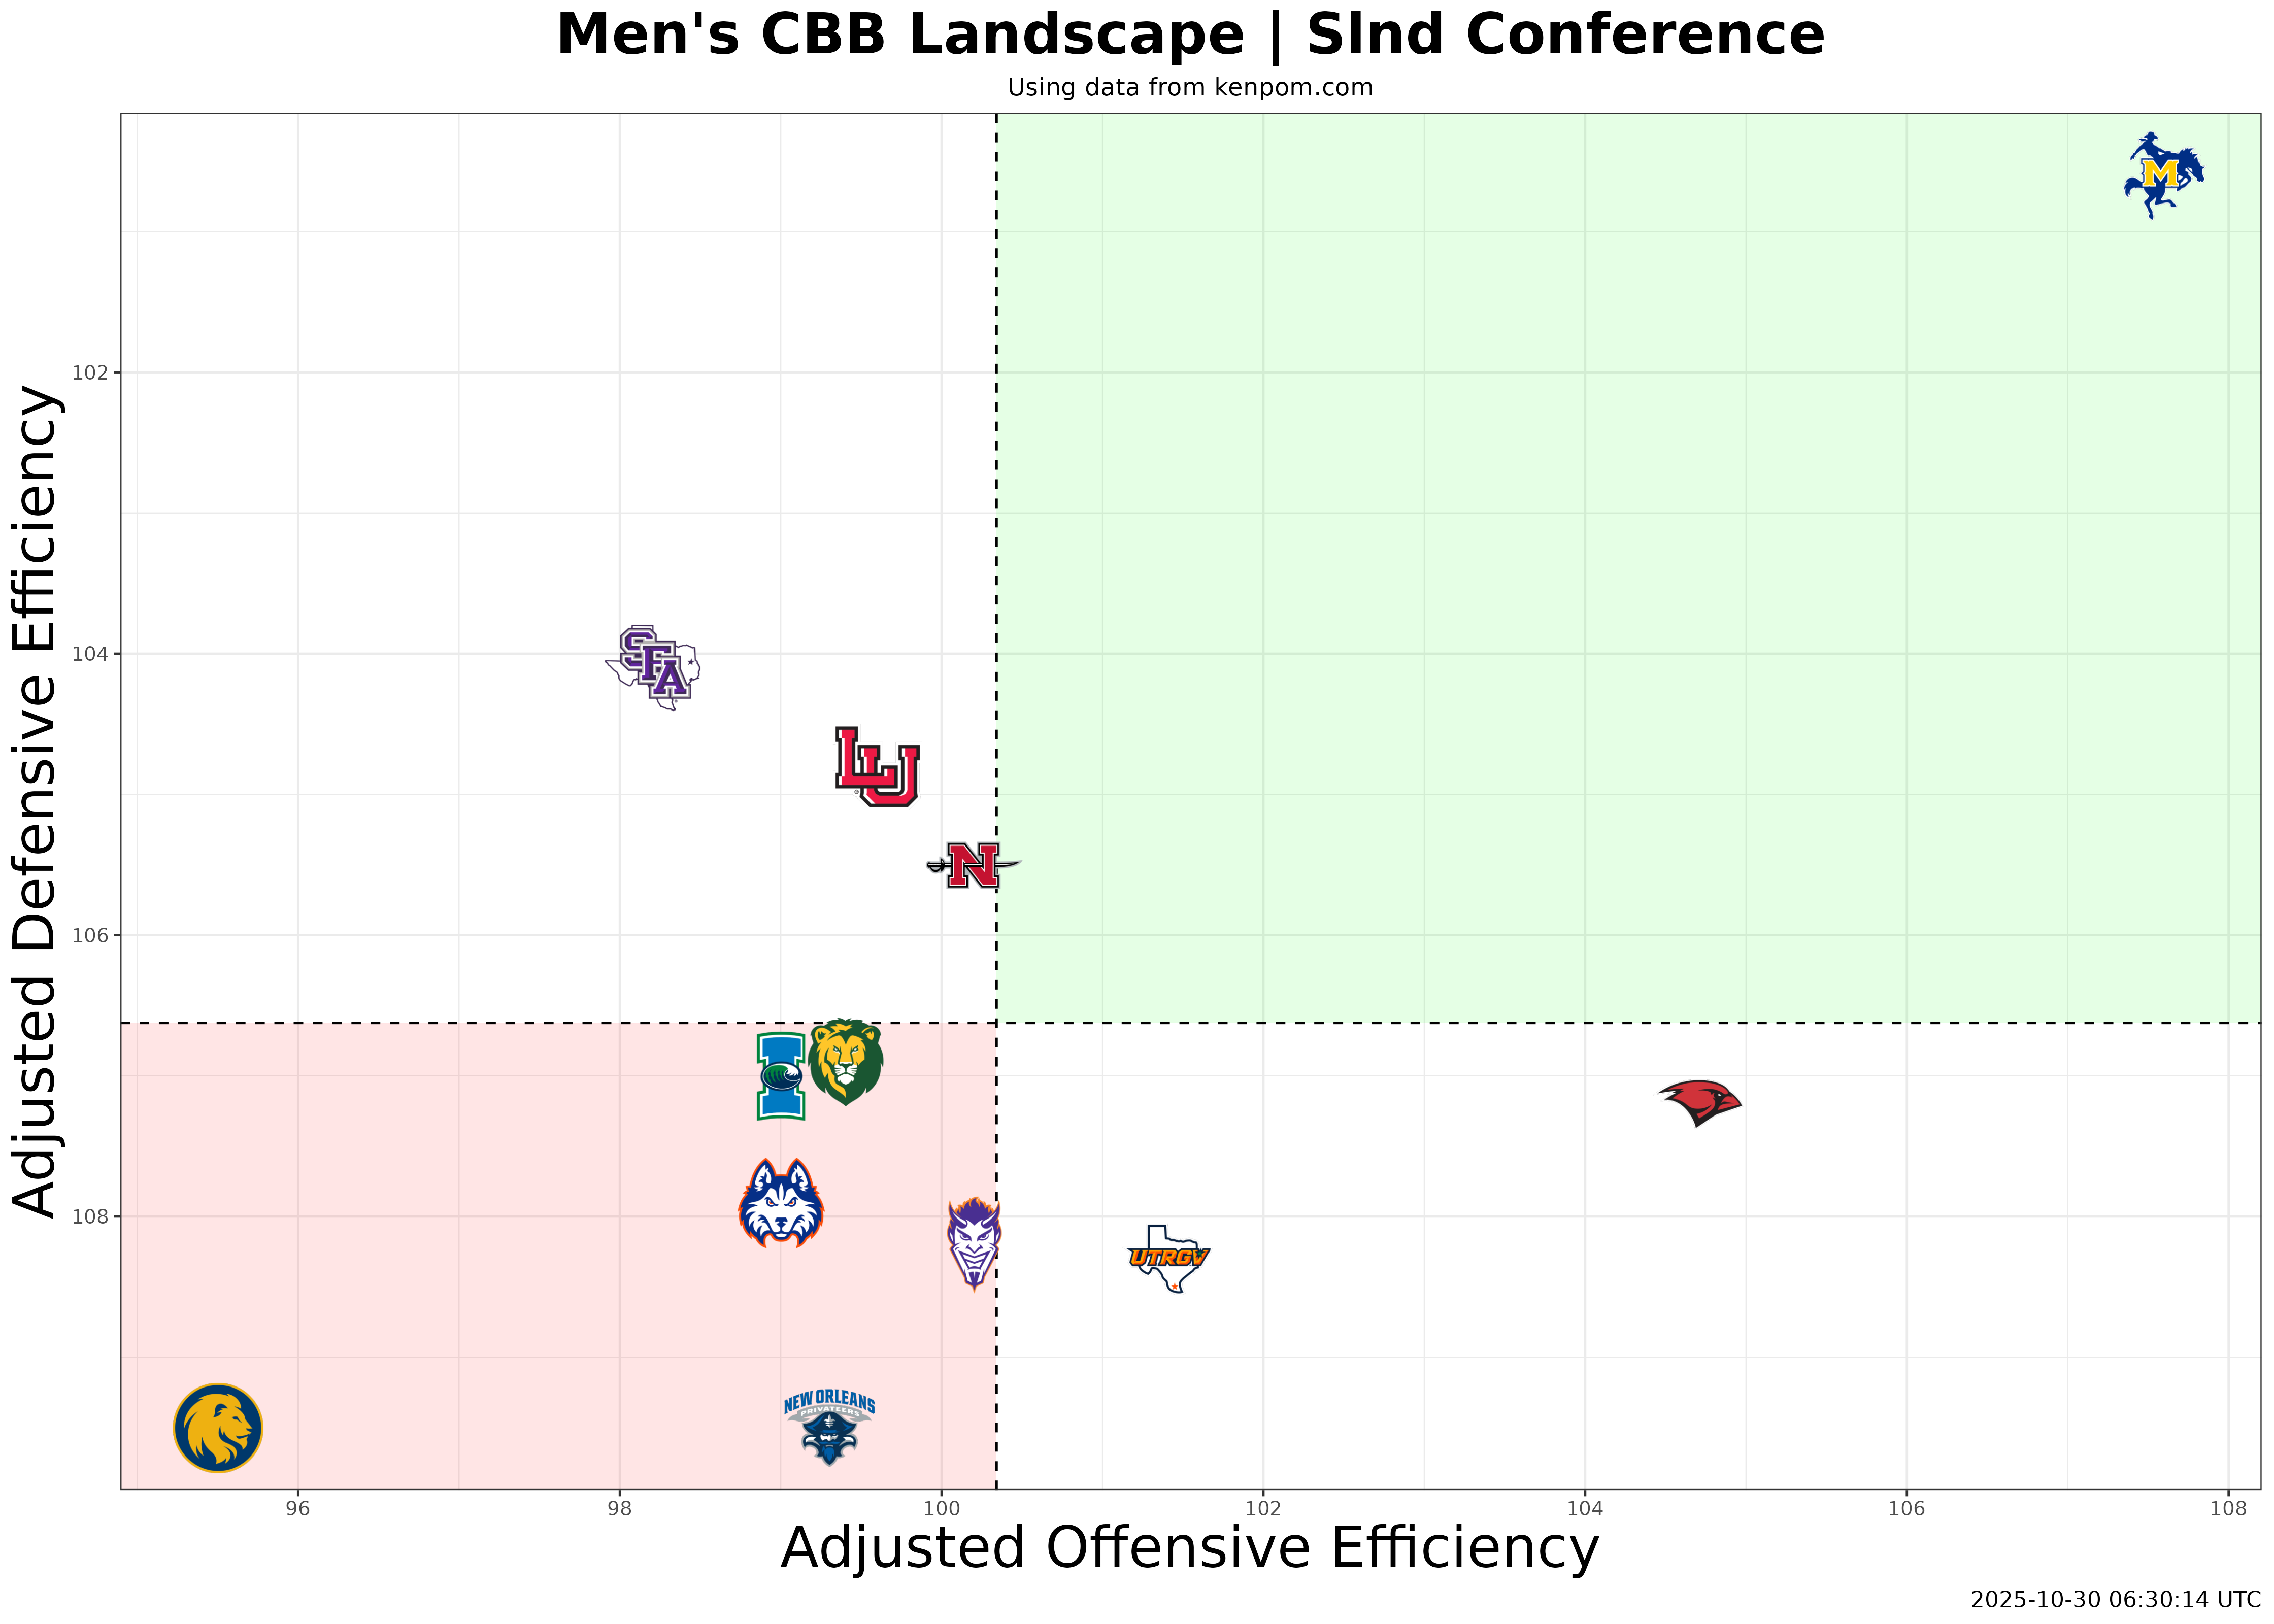
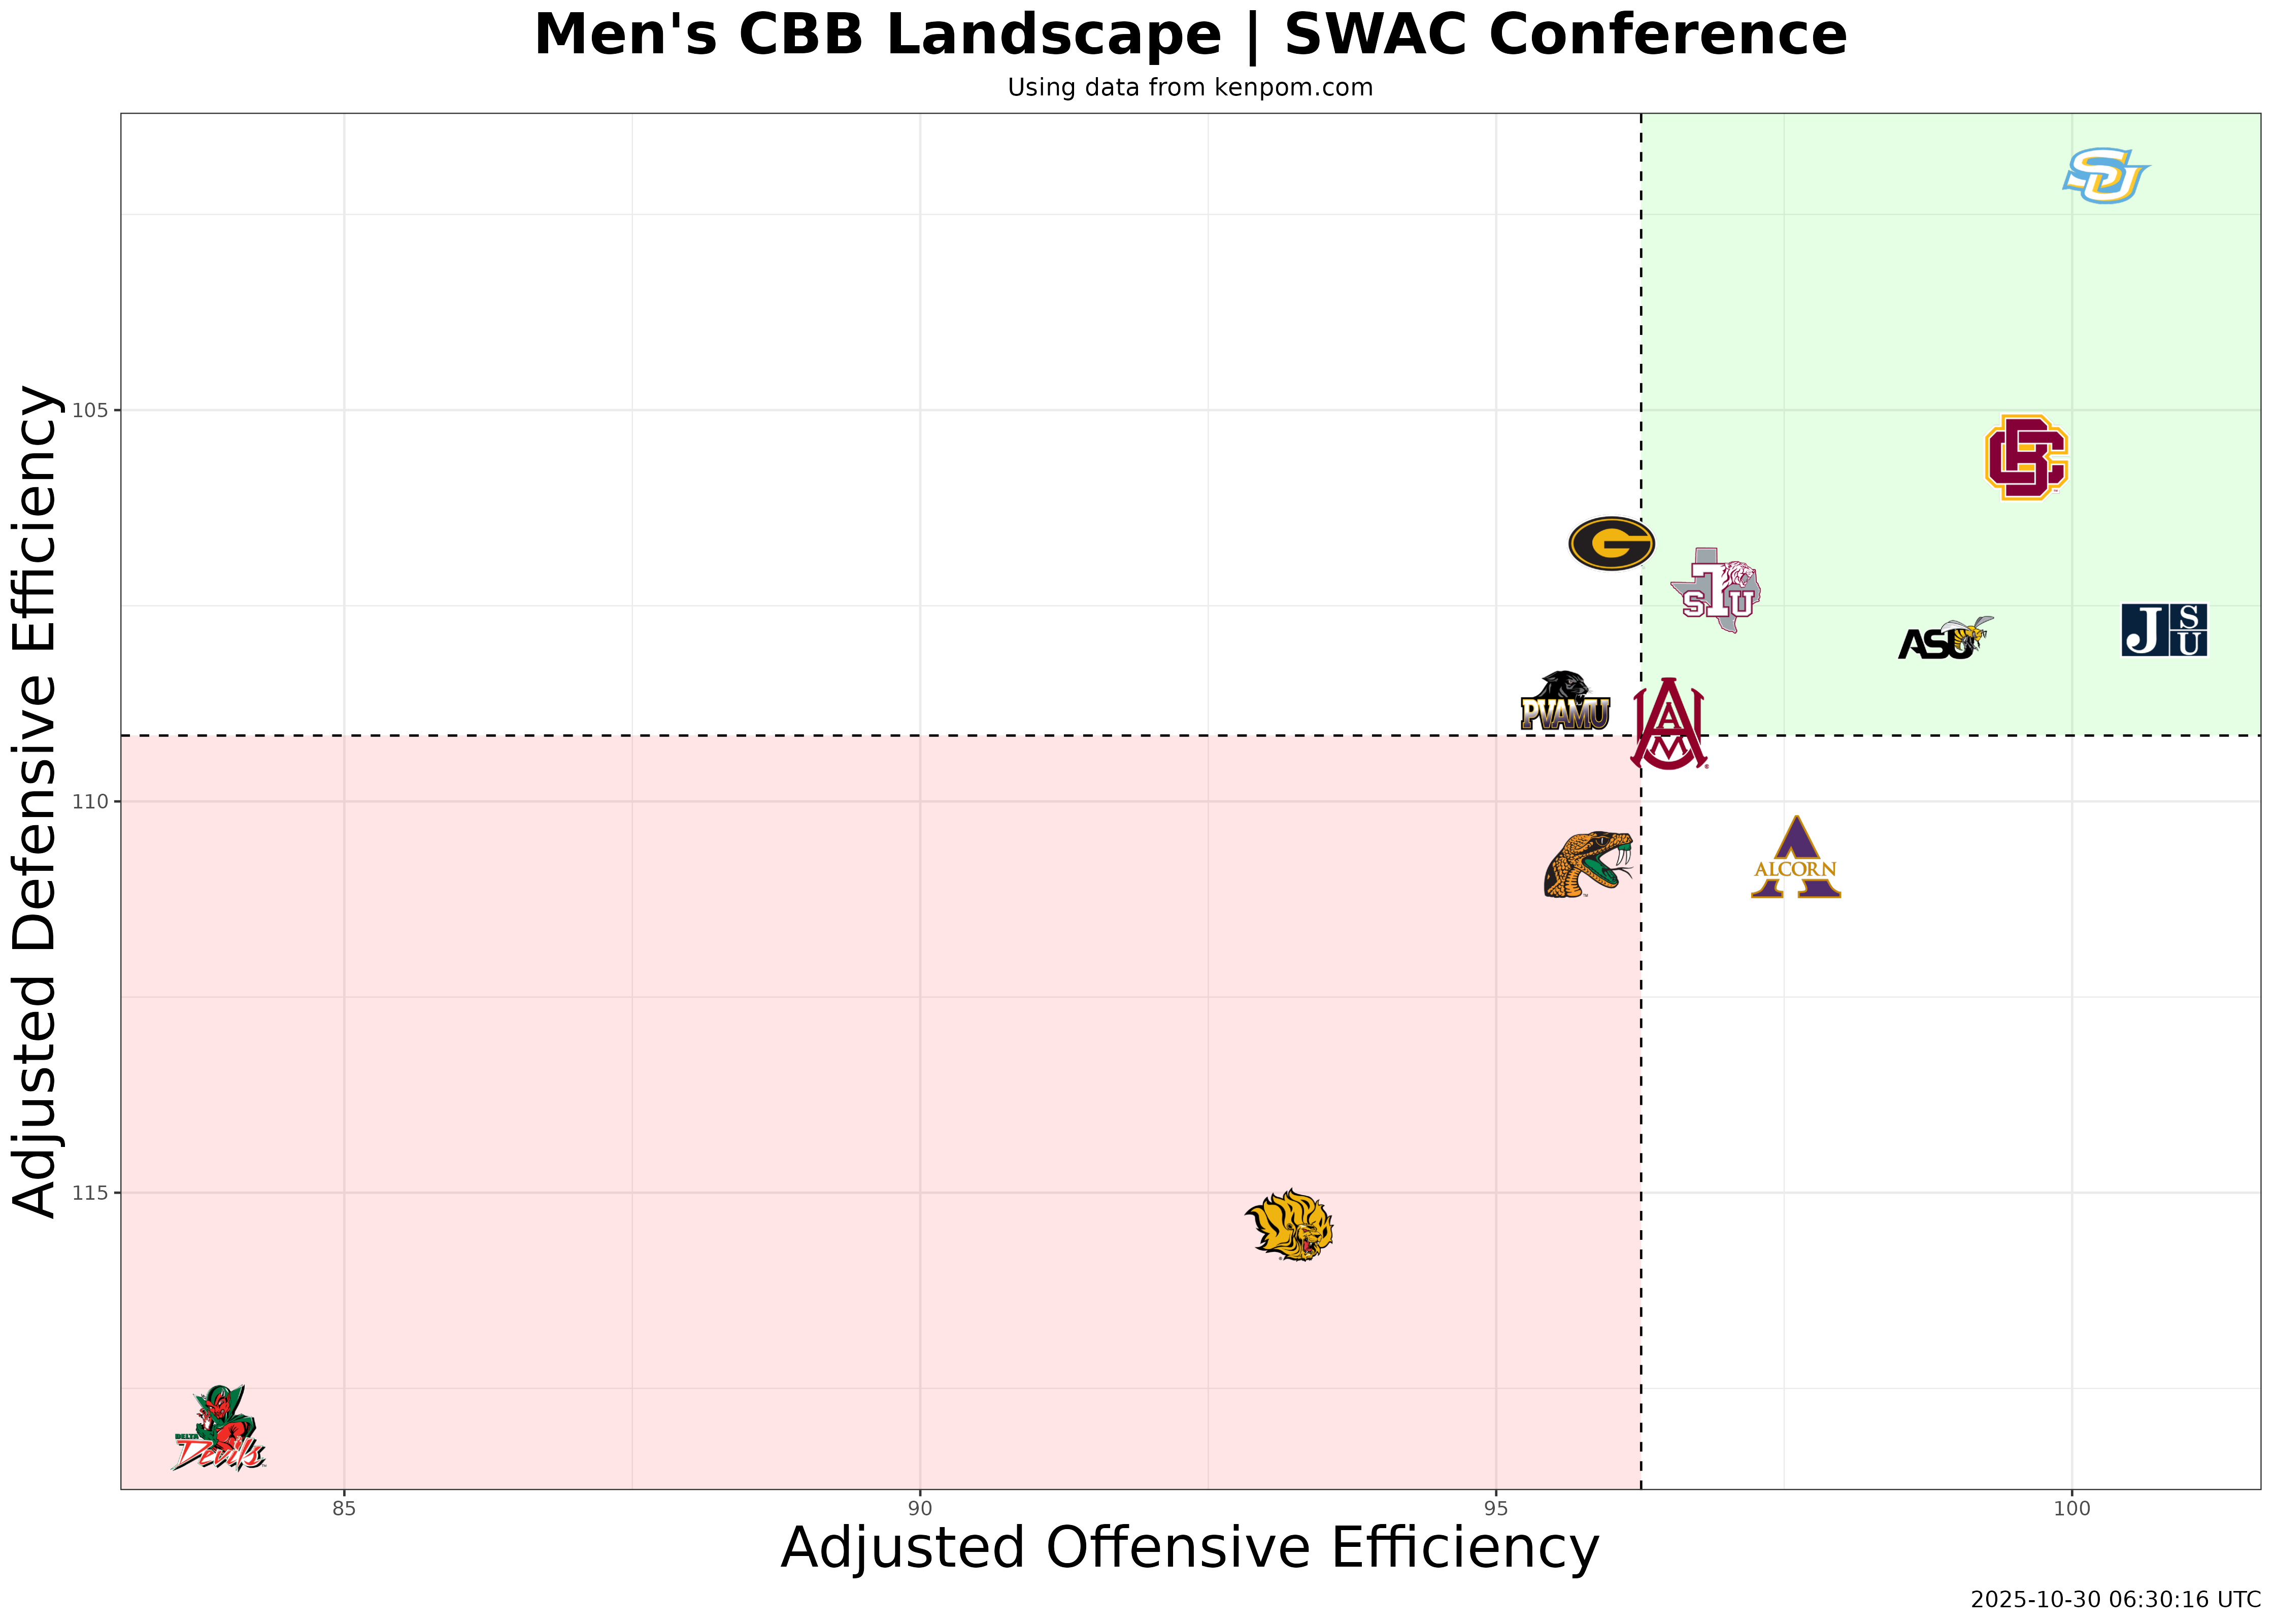
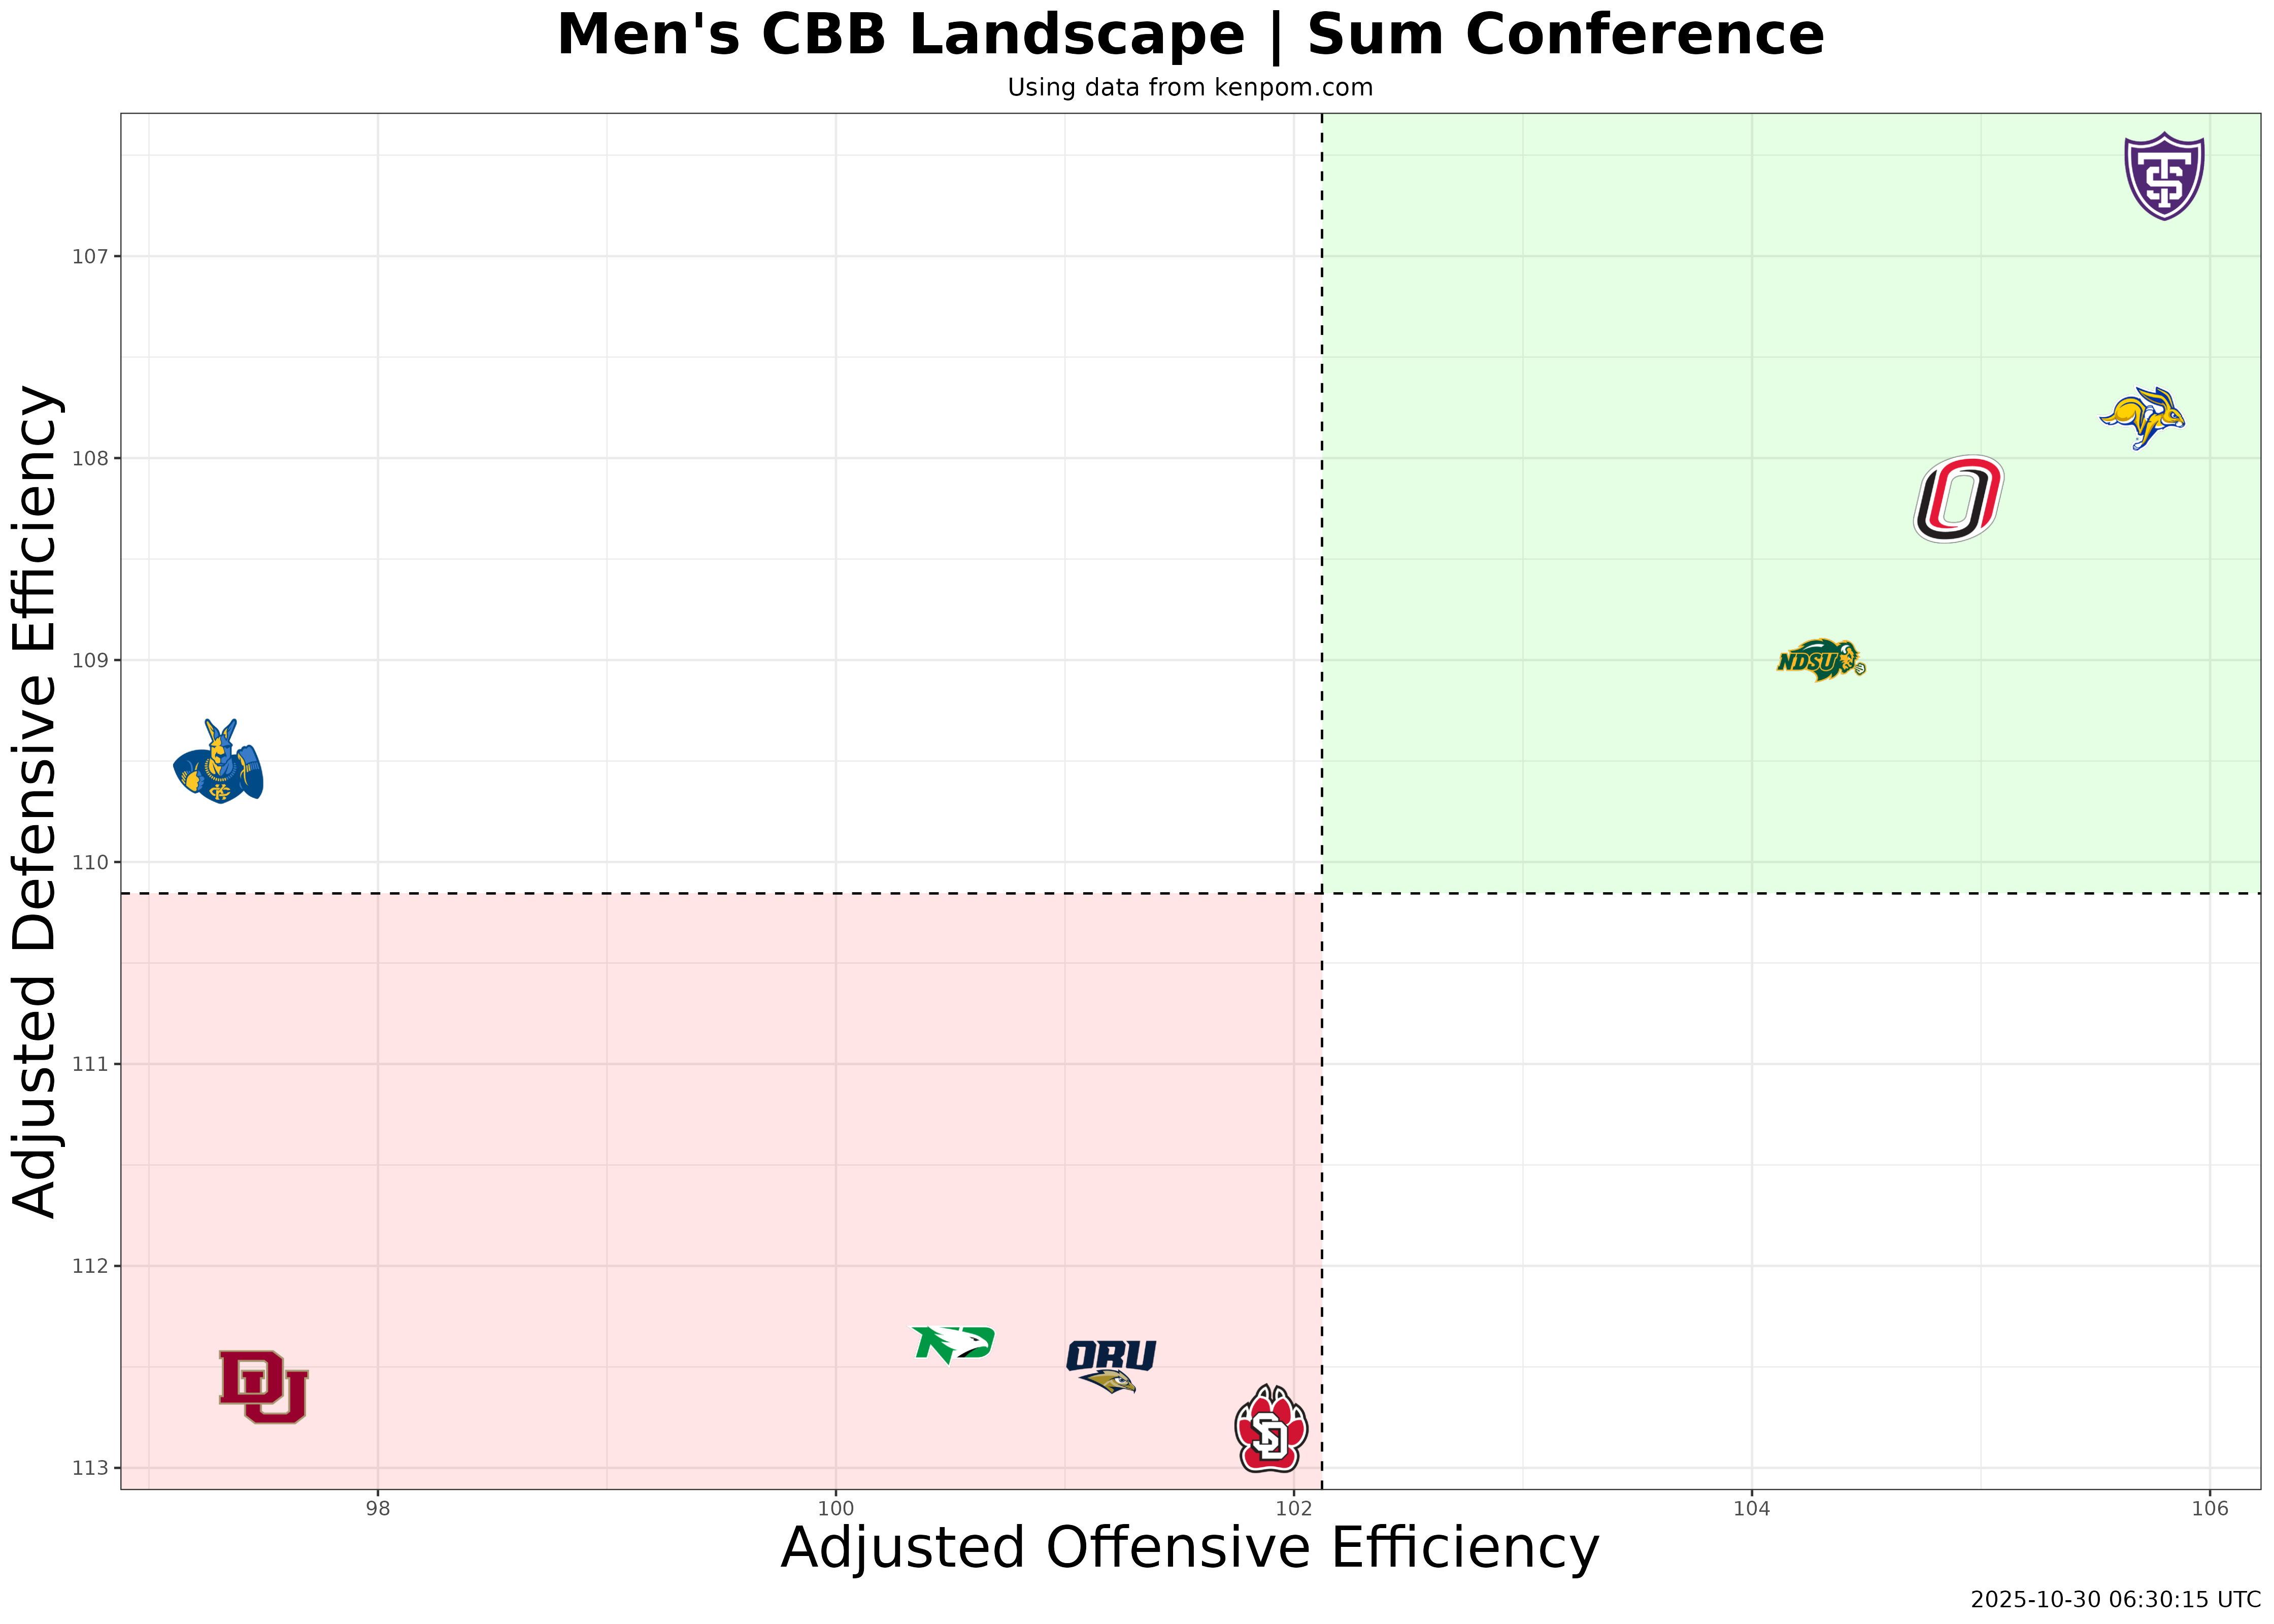
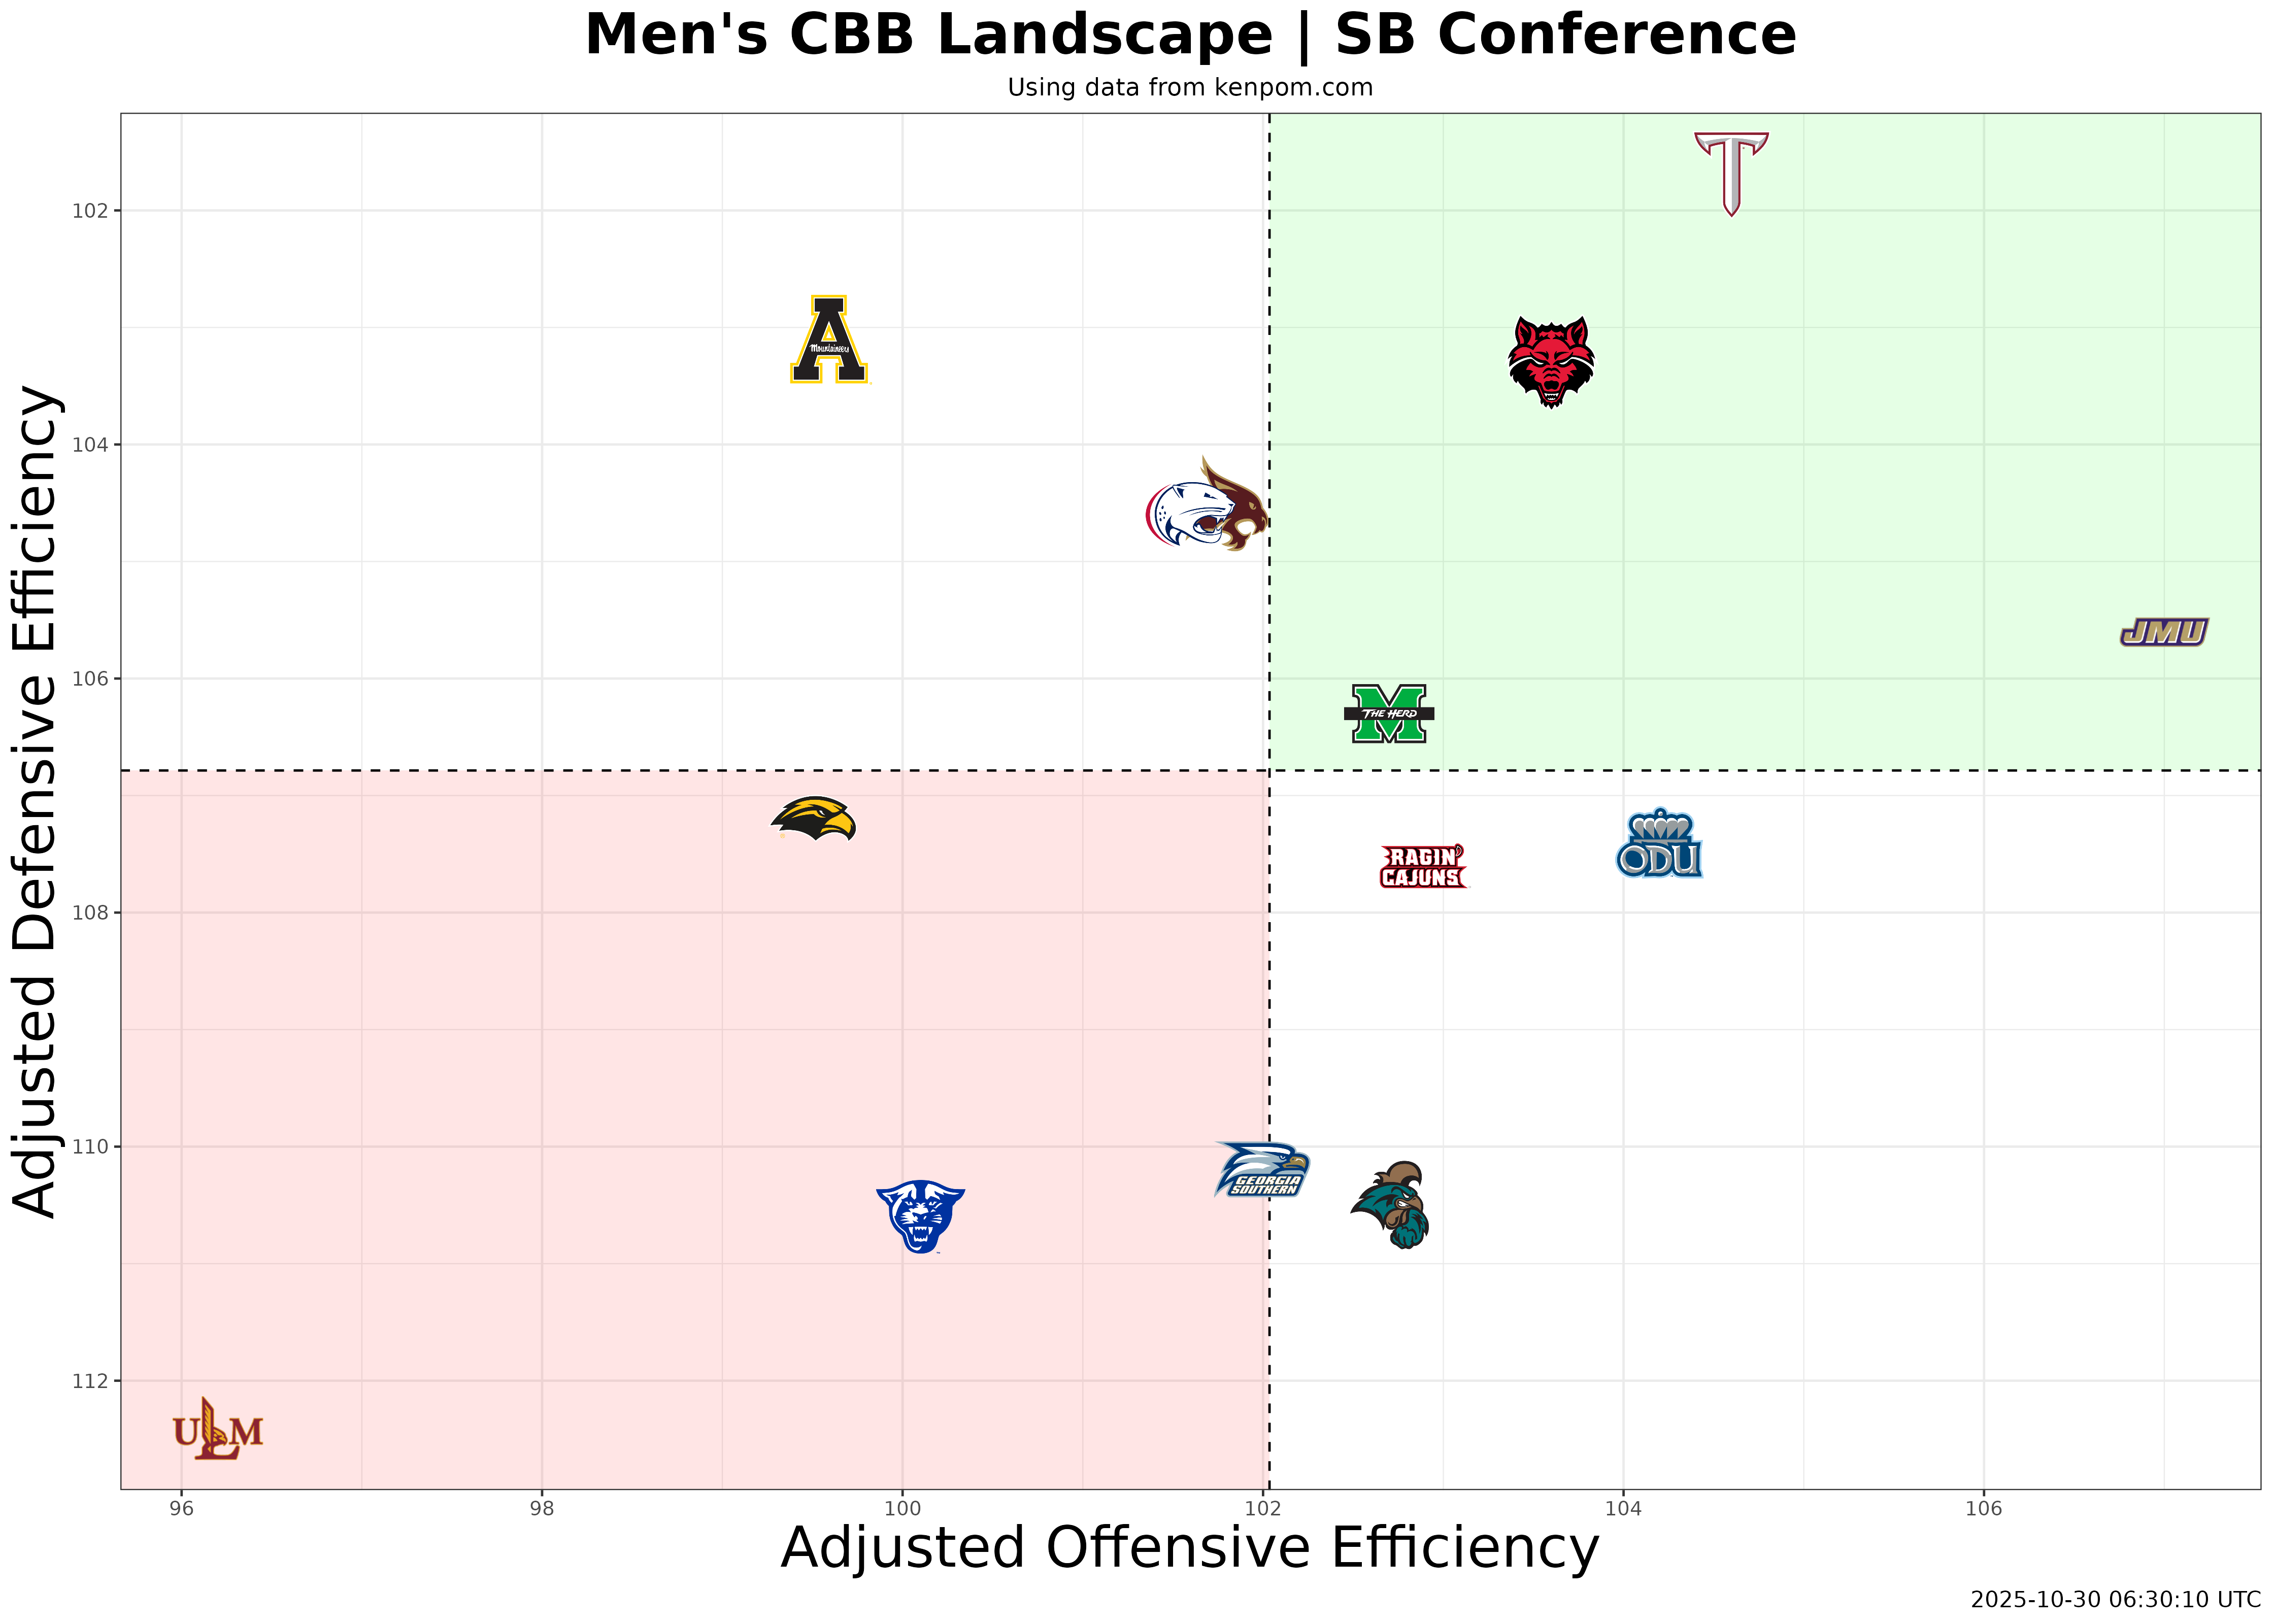
America East - American - Atlantic Sun - Atlantic 10 - Big Sky - Big South - Big West - Colonial - Conference USA - Horizon - Ivy League - Metro Atlantic Athletic - MidAmerican - MidEastern - Missouri Valley - Mountain West - Northeast - Ohio Valley - Patriot League - Southern - Southland - Southwestern Athletic - Summit League - Sun Belt - West Coast - Western Athletic